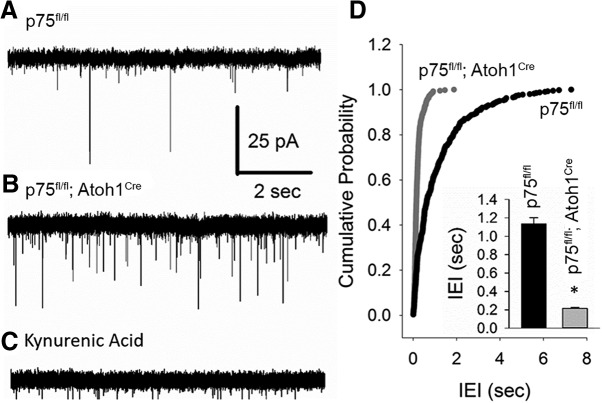
Figure 5.
PC mEPSC frequency is enhanced in p75NTRfl/fl; Atoh1Cre mice. A–C, Representative current traces of action potential independent mEPSCs in PCs from p75NTRfl/fl (indicated as WT) (A) and p75NTRfl/fl; Atoh1Cre mice (B) recorded in 1 μm TTX. All synaptic events were abolished in the presence of the glutamate receptor antagonist kynurenic acid (C). D, Cumulative probability plots of mEPSC interevent interval from 8 cells each from 3 WT mice and 3 p75NTRfl/fl; Atoh1Cre mice. p < 0.05 (Kolmogorov–Smirnov test). Inset, Histogram of mEPSC interevent interval averaged within each cell. *p < 0.05 (Student's t test). Error bars indicate mean ± SEM.

