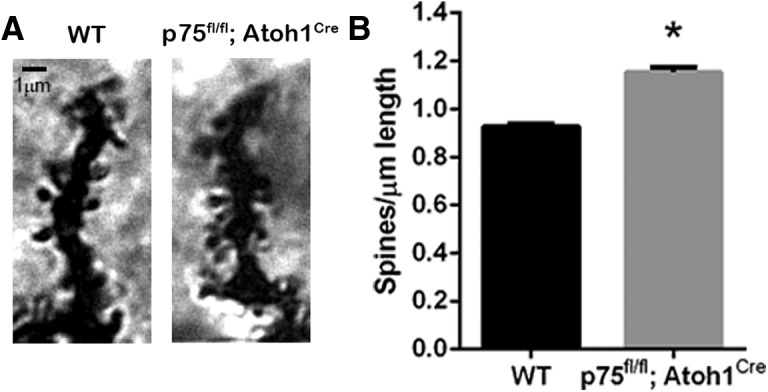
Figure 6.

Dendritic spine analysis of PCs. A, Golgi staining of a distal dendritic branch of a PC in adult WT or p75fl/fl; Atoh1Cre mice. B, Dendritic spine analysis represented as the number of spines per length of the segment analyzed. Six animals per genotype were analyzed. *p < 0.0001 (unpaired Student's t test; Cohen's d effect size = 5.69). Error bars indicate mean ± SEM.
