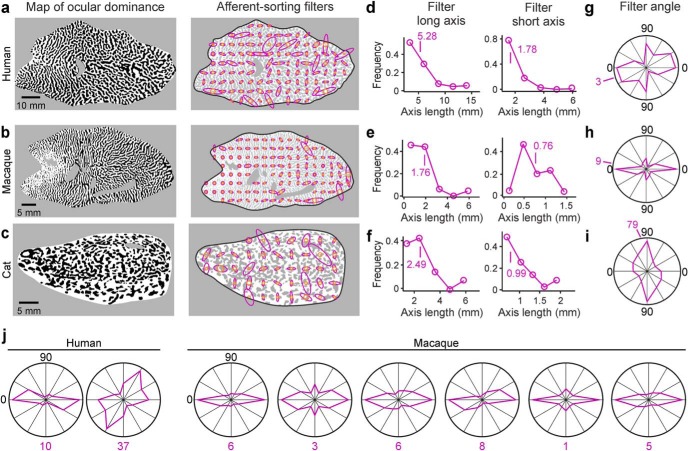
Figure 10.
ASF set associated with each ocular dominance map. a, Map of ocular dominance (left, same as Fig. 2a) and the associated set of ASFs (right) obtained from human cortex. b, Same as in a, but for male macaque (same ocular dominance map as Fig. 2c). c, Same as in a, but for cat (same ocular dominance map as Fig. 2e). d–f, Distribution of ASF lengths obtained from human (d), macaque (e), and cat (f) ocular dominance maps, shown separately for the longest (left) and shortest (right) axes of the filter. g–i, Distribution of filter angles and mean (purple number) obtained from ocular dominance maps from human (g), macaque (h), and cat (i). j, Distribution of filter angles obtained from other ocular dominance maps from human (left) and macaque (right). Most filter angles tend to be parallel to the longest axes of area V1 in macaques.

