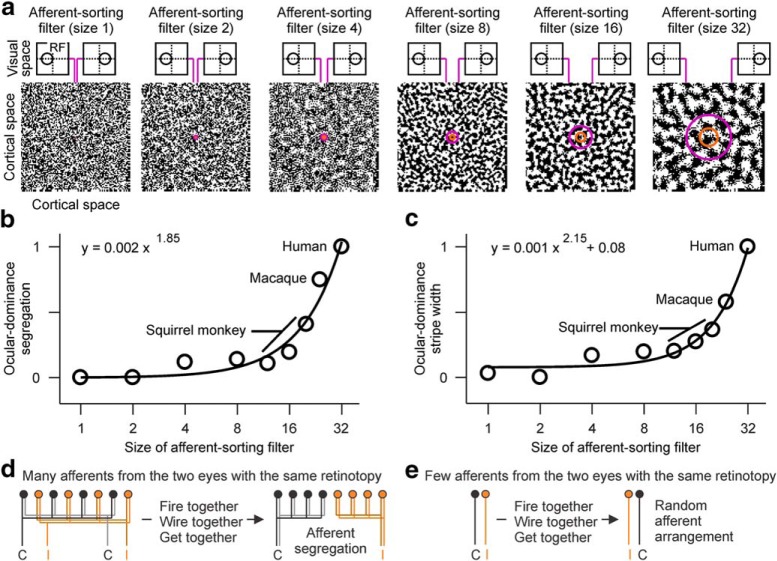
Figure 12.
Simulations of ocular dominance segregation in visual cortex. a, Simulation of cortical patches processed with different ASFs, from the smallest filter on the left (size 1) to the largest on the right (size 32). The size of the filter represents the cortical region receiving afferents with overlapping receptive fields. Afferents at the borders of the filter have nonoverlapping receptive fields (RF), as illustrated at the top of each figure panel. b, Strength of ocular dominance segregation (measured as maximum power in Fourier space) as a function of ASF size. The segregation strength increases with filter size following a power function with an exponent of 1.85. Top, Equation. c, Same as in b, but for stripe width. The model assumes a normalized stripe width of 1 for human visual cortex, which is used as reference to estimate the relative values for macaques and squirrel monkeys in c and then b. d, The model assumes that animals showing ocular dominance segregation have many afferents from the contralateral (C) and ipsilateral (I) eyes with overlapping receptive fields. Afferents with the same retinotopy from the same eye tend to fire together, connect to common targets and become neighbors in cortex, which reduces the axon needed for their connections. e, The model assumes that animals lacking ocular dominance segregation have very few afferents from the two eyes with overlapping receptive fields. Because the number of afferents from the two eyes with the same retinotopy is very limited, they remain randomly distributed in cortex.

