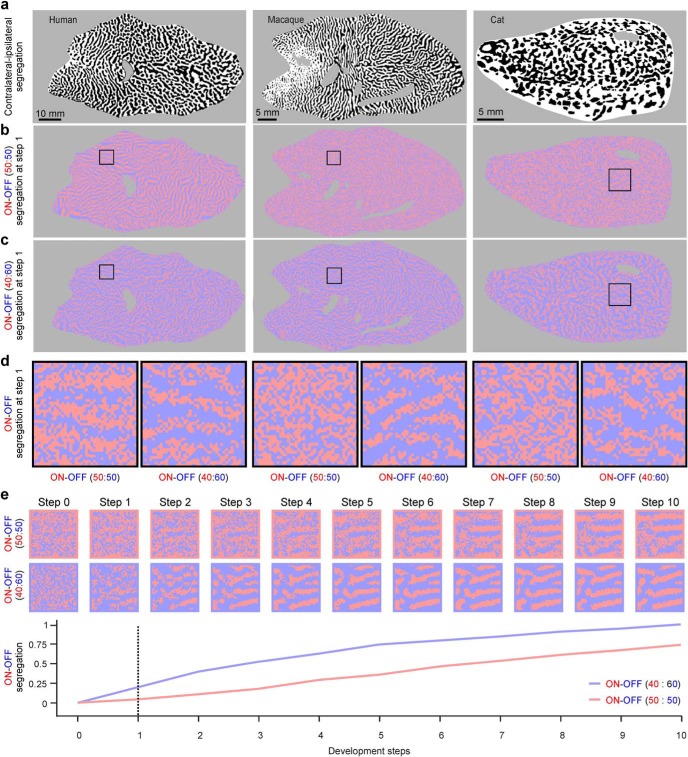
Figure 13.
Simulations of ON-OFF segregation in visual cortex. a, V1 maps of ocular dominance used to obtain the ASFs for ON-OFF segregation (same maps of Fig. 2). b, Simulation of ON-OFF segregation for the V1 ocular dominance maps shown in a. c, Same as in b, but using 40% of ON afferents and 60% of OFF afferents instead of 50% of each. d, Detail of cortical square patch shown in b and c to illustrate better the more pronounced ON-OFF segregation when the cortex is OFF dominated (40% of ON and 60% of OFF afferents vs 50% of each). e, Strength of ON-OFF segregation for consecutive developmental steps showing the stronger segregation for the OFF dominated cortex. Top, Images represent example square patches from the macaque maps used to obtain the values in the plot below.

