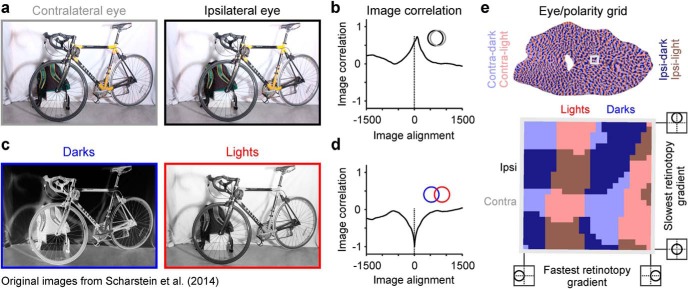
Figure 14.
The eye/polarity grid. A model of visual cortical topography. a, Stereogram illustrating the image of a bicycle processed by the contralateral eye (left, gray frame) and ipsilateral eye (right, black frame). Images from public domain (http://vision.middlebury.edu/stereo/). b, Correlation between the two images illustrated in a, measured when the images are aligned (0 at x axis) and misaligned within a range between −1500 and 1500 pixels. The correlation between images seen by two frontal eyes is positive. Therefore, neighboring afferents from the two eyes should be most strongly correlated when they have overlapping receptive fields (inset). c, Stereogram illustrating the image of the bicycle processed by OFF (left, blue frame) and ON (right, red frame) cortical pathways. d, Image correlation of the two images illustrated in c. The correlation between images processed by ON and OFF cortical pathways is negative. Therefore, ON and OFF neighboring afferents should be most strongly correlated when they have partially overlapping receptive fields (inset). e, Simulation of the eye/polarity grid in human cortex shown for the entire map (top) and a cortical patch (gray square). Bottom, The cortical patch is shown in more detail. Thalamic afferents from contralateral (contra) and ipsilateral eyes (ipsi) segregate in a cortical axis (eye axis) orthogonal to the axis for ON and OFF thalamic segregation (polarity axis). The retinotopic gradient within the cortical patch is slowest along the eye axis to maximize the binocular retinotopic match across the ocular dominance border, which is needed for depth perception. It is fastest along the polarity axis to maximize the retinotopic mismatch across the ON-OFF border, which is needed to process stimulus orientation.

