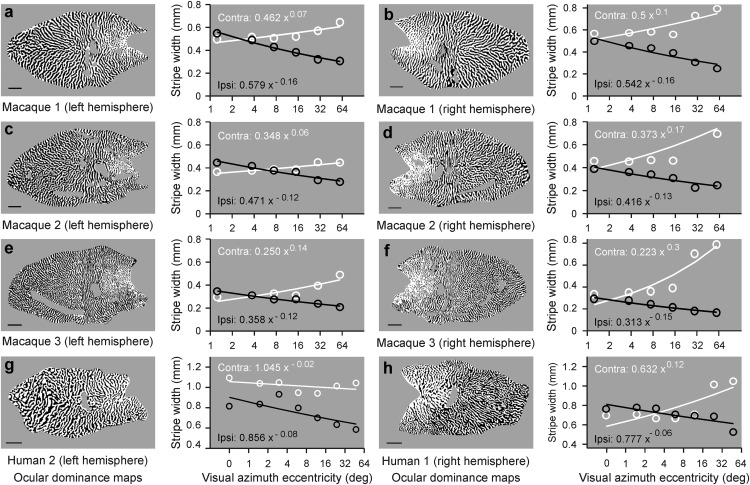
Figure 3.
Correlation between cortical stripe width and eccentricity. a, Cortical map of ocular dominance from a male macaque (left) and scatter plot showing a reduction in the width of ipsilateral-eye stripes (ipsi, in black) with eccentricity. The contralateral-eye stripes (contra, in white) tend to increase with eccentricity but the width change is not as pronounced as for the ipsilateral-eye stripes. Lines indicate fits to the power functions (equations shown in white for contralateral eye and black for ipsilateral eye). Scale bars: human, 10 mm; macaque, 5 mm. Ocular dominance map reproduced with permission from Horton and Hocking (1996). b–f, Same as in a, but for other male (b–d) and female (e, f) macaques. Reproduced with permission from Horton and Hocking (1996). g, h, Same for other human ocular dominance maps. Reproduced with permission from Adams et al. (2007).

