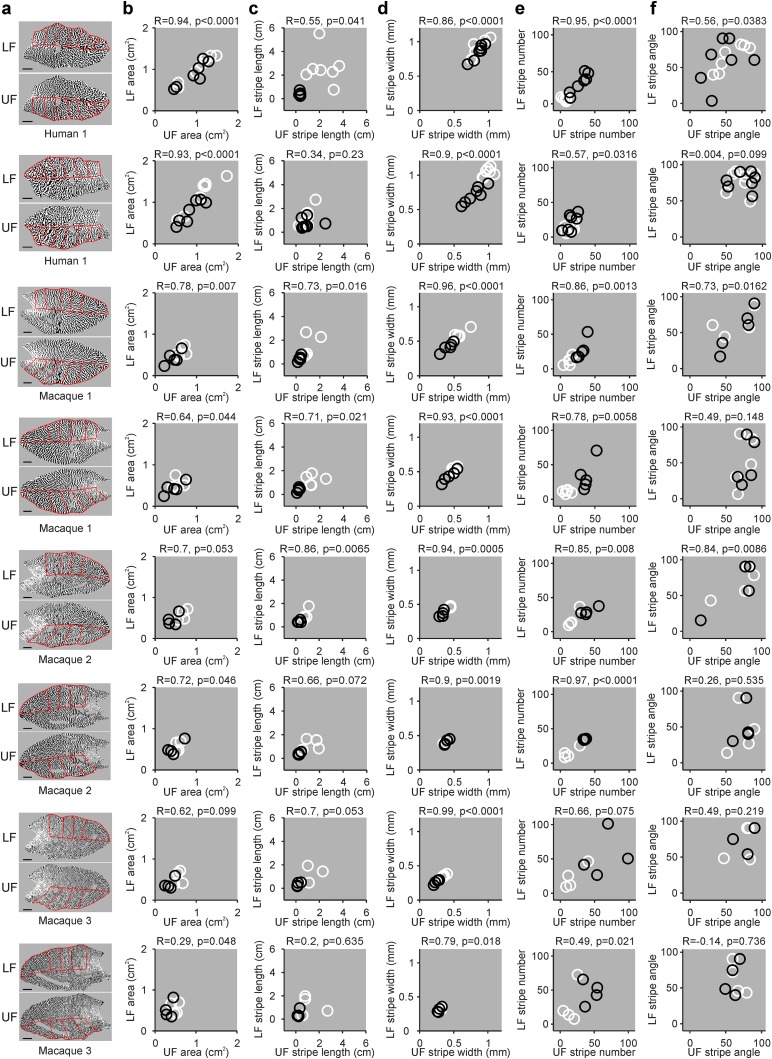
Figure 5.
Correlation between ocular dominance patterns between the two V1 halves representing lower and upper visual fields. a, Maps of ocular dominance from the V1 halves representing the lower visual field (LF) and upper visual fields (UF), obtained from the same brains shown in Figure 4. Scale bars: human, 10 mm; macaque, 5 mm. b, Correlations between UF and LF areas for Human 1 and Macaques 1–3. Each circle represents a measurement from a different retinotopic sector for the contralateral eye (white) and ipsilateral eye (black). c–f, Same as in b, but for stripe length (c), stripe width (d), stripe number (e), and stripe angle (f).

