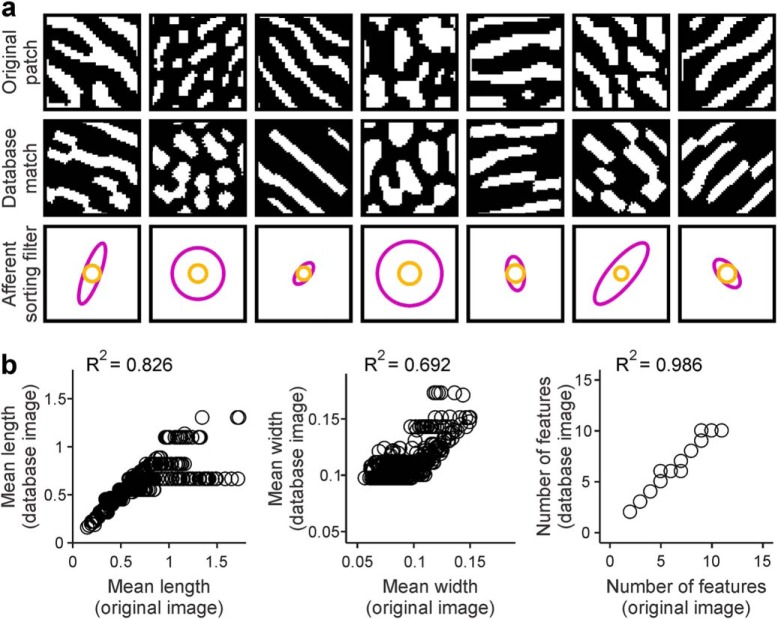
Figure 9.
Reproducing the ocular dominance pattern of each local cortical patch published in the scientific literature with ASFs. a, Ocular dominance patterns of cortical patches published in the scientific literature (top) and selected best matches from a database (middle) of patterns generated with ASFs (bottom). b, Ocular dominance comparison between mean parameters of the original cortical patches (x axis) and best matches obtained from our database (y axis), shown for mean length (left), mean width (middle), and number of features (right).

