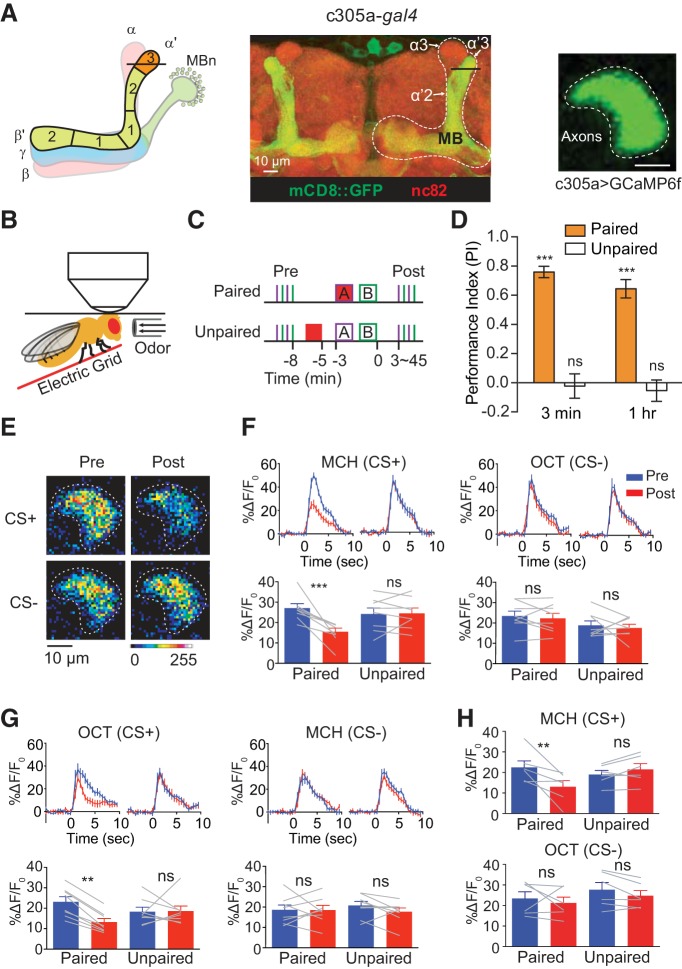
Figure 1.
Pairing of odor and electric shock induces suppression to CS+ odors in the α′3 compartment. A, Left, Schematic diagram of MB showing α′β′ lobe neuropil and its five compartments from a frontal perspective. The line across α′3 indicates the plane that was selected for imaging. Middle: morphology of MB α′β′ lobe neuropil visualized using c305a-gal4 > mCD8::GFP. Right, Representative in vivo image of GCaMP6f expression in the α′3 region driven by c305a-gal4 (scale bar, 10 μm; brightness and contrast were adjusted for better visualization). B, Schematic diagram of the in vivo training setup. The fly head is glued to a thin metal plate. There is a small hole in the plate through which the head cuticle is dissected and the brain can be imaged. The electric shock pulses are delivered to the fly through an electric grid contacting the fly's legs. Odor is delivered to the fly via glass pipette (∼3 mm diameter) whose tip is close to the antenna of the fly (arrows indicate odor flow direction). C, Paired and unpaired training protocol. In paired training, 1 min of 12 pulses electric shock and odor A (CS+) were presented simultaneously followed by odor B (CS−) that was unpaired with shock. In unpaired training, 1 min of electric shock pulses was presented 3 min before odor A onset. Before training, two pulses of each odor were presented to the fly in alternating fashion for 5 s each with a 30 s interstimulus interval (Pre). After training, an identical set of odor pulses were presented to the fly (Post). D, Behavior performance of flies receiving paired and unpaired training protocols. Paired training induced robust memory performance at both 3 min and 1 h after training. However, unpaired training induced no memory at 3 min or 1 h after training. Mean ± SEM, ***p < 0.0001, ns, not significant, p ≥ 0.4976, one sample t test against a theoretical mean of “0,” n = 6. E, Pseudocolored peak responses of α′3 axon segments to CS+ and CS− before (Pre) and 3 min after (Post) paired training. F, Left top, Time course of GCaMP6f response in α′3 to CS+ (MCH) during 5 s odor presentation before (Pre, blue) and 3 min after (Post, red) paired or unpaired training. Traces show the average response (±SEM) across all flies tested. Bottom, Mean odor-evoked Pre and Post responses during the 5 s odor presentation. Right, Responses to the CS− (OCT). Data are shown as mean ± SEM. ***p = 0.0003; ns, not significant, p > 0.9999; repeated-measures two-way ANOVA with Bonferroni post hoc tests, n = 8. G, Left top, Time course of GCaMP6f response in α′3 to OCT (CS+) during a 5 s odor presentation before (Pre, blue) and 3 min after (Post, red) paired or unpaired training. Traces show the average response (±SEM) across all flies tested. Bottom, Mean odor-evoked Pre and Post responses during 5 s odor presentation. Right, Responses to the CS− (MCH). Data are shown as mean ± SEM. **p = 0.0022; ns, not significant, p ≥ 0.4230; repeated-measures two-way ANOVA with Bonferroni post hoc tests, n = 8. H, Top, Mean odor-evoked Pre and Post responses during 5 s odor presentation to MCH (CS+) with 6 pulses of 30 V electric shock training protocol. Bottom, Responses to the CS− (OCT). Mean ± SEM, **p = 0.0077; ns, not significant, p ≥ 0.6267; repeated-measures two-way ANOVA with Bonferroni post hoc tests, n = 6.

