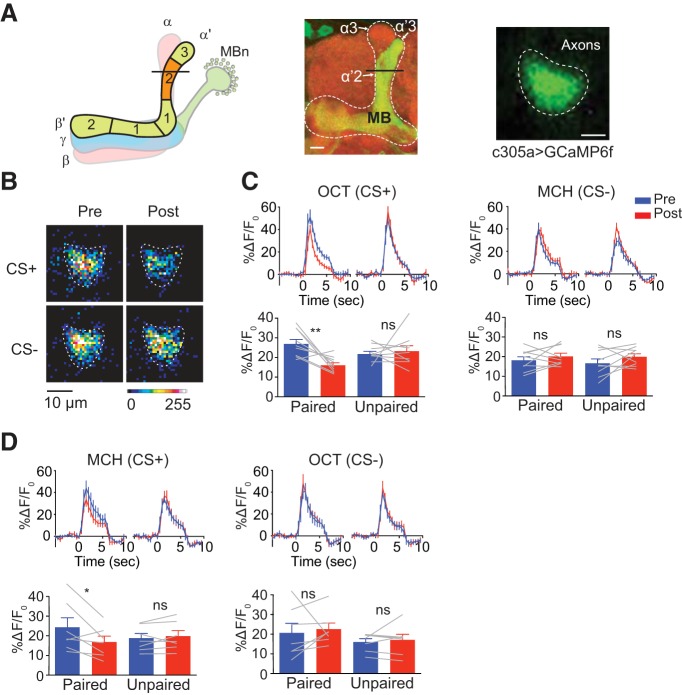
Figure 3.
Pairing of odor and electric shock induces suppression to CS+ odors in the α′2 compartment. A, Left, Schematic diagram of MB showing α′β′ lobe neuropil and its five compartments. The line across α′2 indicates the plane that was selected for imaging. Middle: morphology of MB α′β′ lobe visualized using c305a-gal4 > mCD8::GFP. Right, Representative in vivo image of GCaMP6f expression in the α′2 region driven by c305a-gal4 (scale bar, 10 μm; brightness and contrast were adjusted for better visualization). B, Pseudocolored peak responses of α′2 to CS+ and CS− before (Pre) and 3 min after (Post) paired training. C, Left top, Time course of GCaMP6f response in α′2 to CS+ (OCT) during 5 s odor presentation before (Pre, blue) and 3 min after (Post, red) paired or unpaired training. Traces show the average response (±SEM) across all flies tested. Bottom, Mean odor-evoked Pre and Post responses during 5 s odor presentation. Right, Responses to the CS− (MCH). Data are shown as mean ± SEM. **p = 0.0085; ns, not significant, p ≥ 0.3129; repeated-measures two-way ANOVA with Bonferroni post hoc tests, n = 9. D, Left top, Time course of GCaMP6f response in α′2 to MCH (CS+) during a 5 s odor presentation before (Pre, blue) and 3 min after (Post, red) paired or unpaired training. Traces show the average response (±SEM) across all flies tested. Bottom, Mean odor-evoked Pre and Post responses during 5 s odor presentation. Right, Responses to the CS− (OCT). Data are shown as mean ± SEM. *p = 0.0192; ns, not significant, p > 0.9999; repeated-measures two-way ANOVA with Bonferroni post hoc tests, n = 7.

