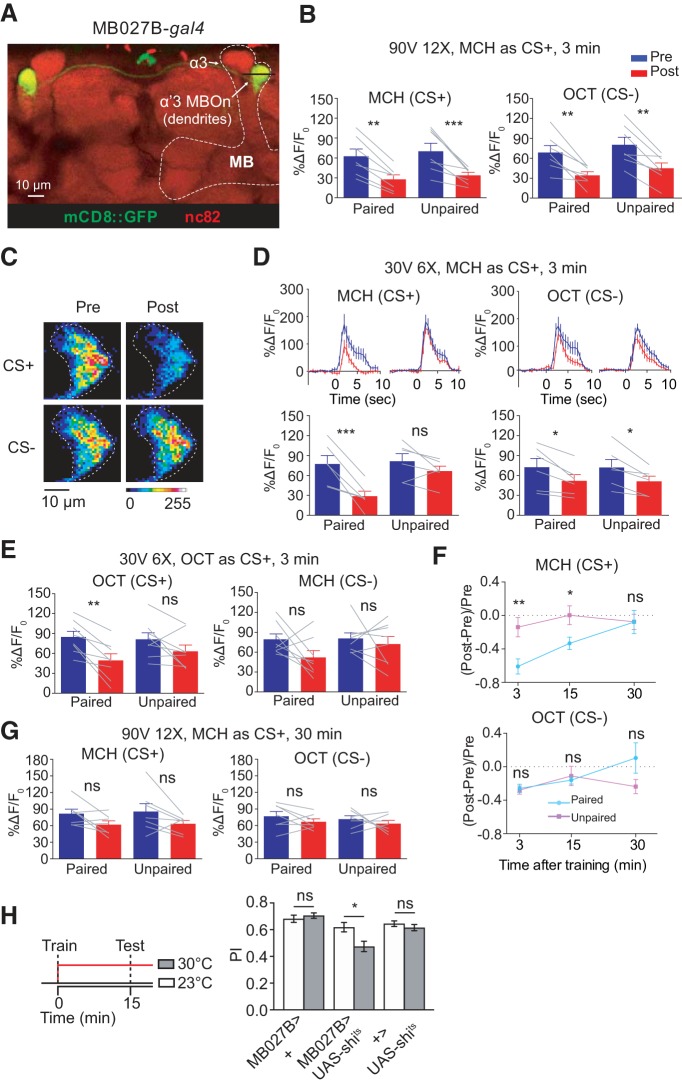
Figure 4.
Pairing of odor and electric shock induces suppression in α′3 MBOn. A, Morphology of postsynaptic MBOn that innervates α′3 compartment visualized using MB027B split gal4 > mCD8::GFP. The line across α′3 MBOn indicates the plane that was selected for imaging. B, Left, Mean odor-evoked GCaMP6f responses in α′3 MBOn to MCH (CS+) during 5 s odor presentation before (Pre, blue) and 3 min after (Post, red) paired or unpaired training with 12 pulses of 90 V electric shock. Right, Responses to OCT (CS−). Data are shown as mean ± SEM. ***p = 0.0008, **p ≤ 0.0021; repeated-measures two-way ANOVA with Bonferroni post hoc tests, n = 7. C, Pseudocolored peak responses of α′3 MBOn to CS+ (MCH) and CS− (OCT) before (Pre) and 3 min after (Post) paired training with 6 pulses of 30 V electric shock. D, Left top, Time course of GCaMP6f response in α′3 MBOn to CS+ (MCH) during 5 s odor presentation before (Pre, blue) and 3 min after (Post, red) paired or unpaired training with 6 pulses of 30 V electric shock. Traces show the average response (±SEM) across all flies tested. Bottom, Mean odor-evoked Pre and Post responses during the 5 s odor presentation. Right, Responses to the CS− (OCT). Data are shown as mean ± SEM. ***p = 0.0009, *p ≤ 0.0119; ns, not significant, p = 0.2951; repeated-measures two-way ANOVA with Bonferroni post hoc tests, n = 6. E, Left, Mean odor-evoked GCaMP6f responses in α′3 MBOn to OCT (CS+) during 5 s odor presentation before (Pre, blue) and 3 min after (Post, red) paired or unpaired training with 6 pulses of 30 V electric shock. Right, Responses to MCH (CS−). Data are shown as mean ± SEM. **p = 0.0029; ns, not significant, p ≥ 0.1236; repeated-measures two-way ANOVA with Bonferroni post hoc tests, n = 8. F, Change of odor response in α′3 MBOn between Post and Pre at 3, 15, and 30 min after paired or unpaired training (CS+:MCH, CS−:OCT). The paired training-induced suppression of CS+ persisted for at least 15 min and became nonsignificant at 30 min. No significant difference was observed in CS− between paired and unpaired groups at any time point. Data are shown as mean ± SEM. **p = 0.0087, *p = 0.0411; ns, not significant, p ≥ 0.3095; Mann–Whitney U test, n = 6. G, Mean odor-evoked GCaMP6f response at 30 min after training in α′3 MBOn during 5 s odor presentation with 12 pulses of 90 V electric shock (CS+:MCH, CS−:OCT). Data are shown as mean ± SEM. ns, not significant, p ≥ 0.1372; repeated-measures two-way ANOVA with Bonferroni post hoc tests, n = 7. H, Blocking synaptic output of α′3 MBOn immediately after training through testing impaired 15 min memory. Flies were trained at 23°C, transferred to 30°C immediately after training for 15 min, and tested at 30°C. Data are shown as mean ± SEM. *p = 0.0186; ns, not significant, p > 0.9999; two-way ANOVA with Bonferroni post hoc tests, n = 6.

