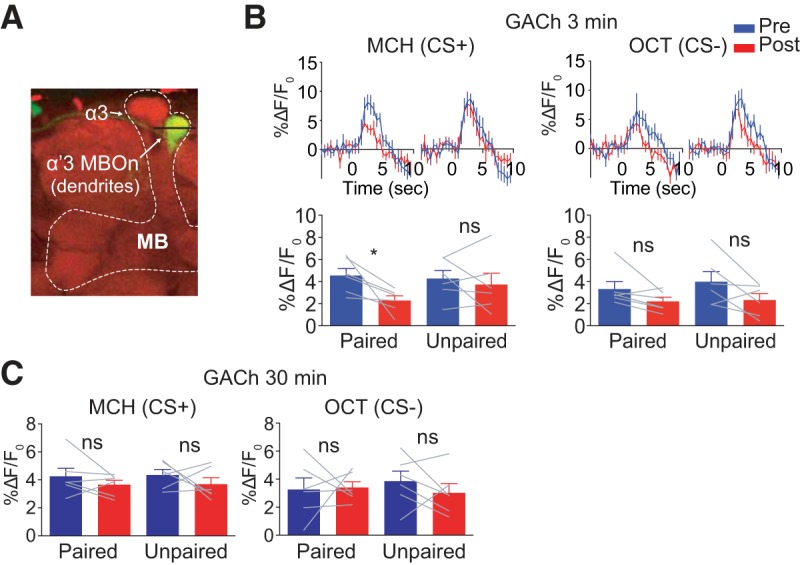
Figure 5.

Pairing of odor and electric shock reduces ACh release in the α′3 compartment. A, Morphology of postsynaptic MBOn that innervates α′3 compartment visualized using MB027B split gal4 > mCD8::GFP. The line across α′3 MBOn indicates the plane that was selected for imaging. B, Left top, Time course of GACh (ACh sensor) response in the dendrites of α′3 MBOn to CS+ (MCH) during 5 s odor presentation before (Pre, blue) and 3 min after (Post, red) paired or unpaired training with 6 pulses of 30 V electric shock. Traces show the average response (±SEM) across all flies tested. Bottom, Mean odor-evoked Pre and Post responses during the 5 s odor presentation. Right, Responses to the CS− (OCT). Data are shown as mean ± SEM. *p = 0.0457; ns, not significant, p > 0.9999 for MCH in unpaired group, p = 0.3003 for OCT in paired group and p = 0.0856 for OCT in unpaired group; repeated-measures two-way ANOVA with Bonferroni post hoc tests, n = 6. C, Mean odor-evoked GACh response at 30 min after training in the dendrites of α′3 MBOn during 5 s odor presentation with 6 pulses of 30 V electric shock (CS+:MCH, CS−:OCT). Data are shown as mean ± SEM. ns, not significant, p ≥ 0.6660; repeated-measures two-way ANOVA with Bonferroni post hoc tests, n = 6.
