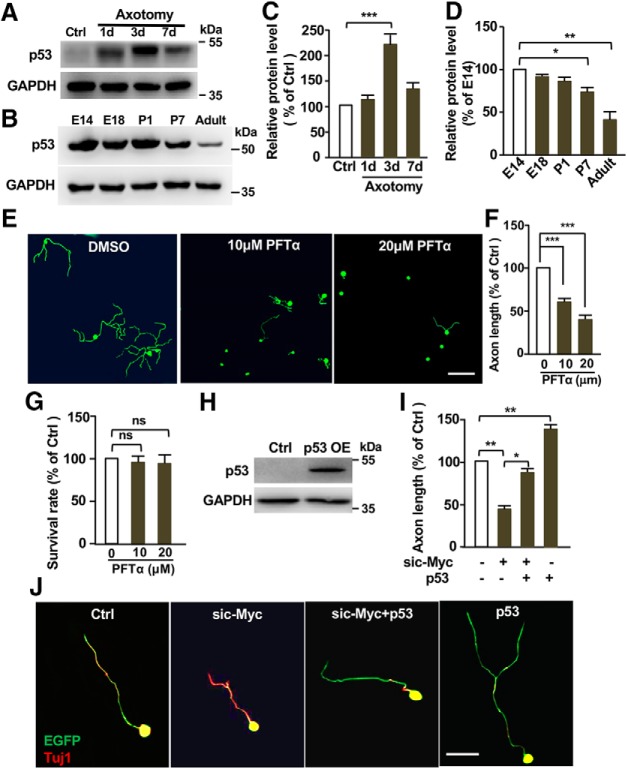
Figure 7.
p53 is necessary and sufficient for supporting sensory axon regeneration in vitro. A, Representative Western blot images showing markedly increased p53 protein levels in DRG tissues at different dates after sciatic nerve axotomy. B, Representative Western blot images showing gradually reduced levels of p53 in DRG tissues during development and maturation. C, Quantification of the Western blot results shown in A from three independent experiments. p = 0.0006. D, Quantification of the Western blot results shown in B from three independent experiments. p = 0.0211 for P7 vs E14, p = 0.0026 for adult vs E14. E, Representative images showing that inhibition of p53 with PFTα in cultured sensory neurons for 3 d dramatically blocked regenerative axon growth. Scale bar, 200 μm. F, Quantification of the average axon lengths in E from three independent experiments. p = 0.0001 for 10 μm vs 0 μm, p = 0.0001 for 20 μm vs 0 μm. G, Quantification of neuronal survival after treatment with DMSO or different concentration of PFTα. ns, No significant difference. H, Representative Western blot images showing increased level of p53 after p53 overexpression (OE) in adult sensory neurons. I, Quantification of the average axon lengths in J from three independent experiments. p = 0.0021 for sic-Myc vs control, p = 0.0152 for sic-Myc vs sic-Myc+p53, p = 0.0034 for p53 vs control. J, Representative images showing that overexpression of p53 were sufficient to promote sensory axon regeneration by itself in vitro and restored axon regeneration inhibited by c-Myc knockdown. Scale bar, 50 μm. Data are represented as mean ± SEM. *p < 0.05, **p < 0.01, ***p < 0.001.

