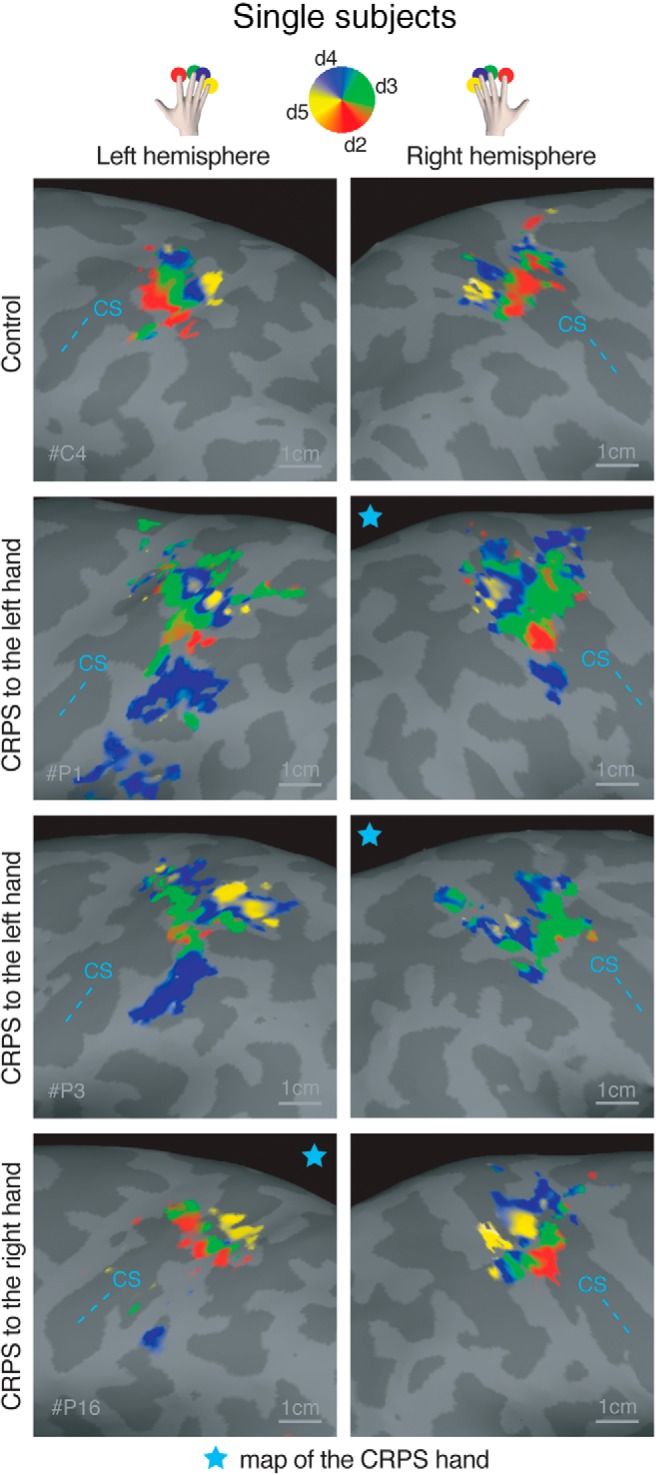
Figure 3.

Phase maps of the hand in an illustrative control participant and 3 CRPS patients. Top, Color-coding scheme: red represents d2; green represents d3; blue represents d4; yellow represents d5. Phases corresponding to rest have been truncated. Statistical thresholding and cluster correction at p < 0.01 were applied to each individual-participant data. CS, Central sulcus. Star represents the map of the CRPS hand.
