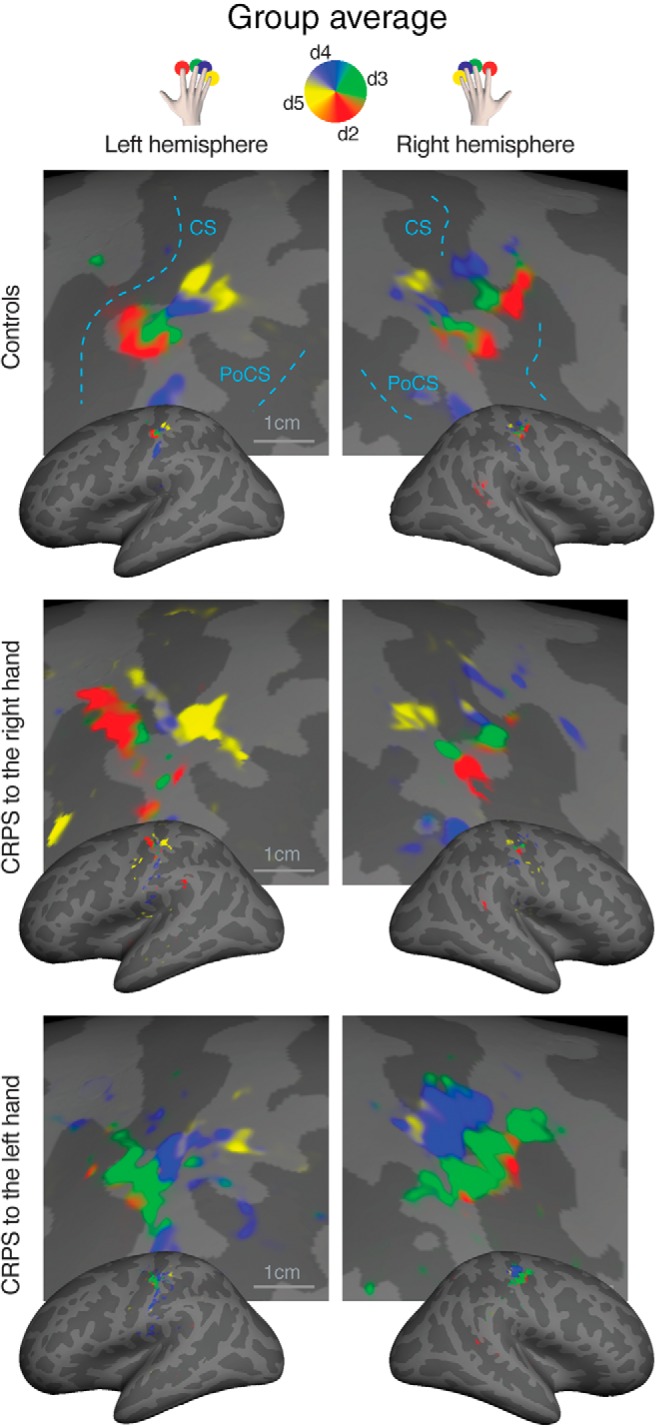
Figure 4.

Surface-based average of phase maps in controls, patients with CRPS to the right hand, and patients with CRPS to the left hand. The complex valued mapping data were averaged in a spherical surface coordinate system after morphing each subject's data into alignment with an average spherical sulcal pattern, and the F statistics were rendered back onto an average unfolded cortical surface (Freesurfer's fsaverage, inflated_average; uncorrected p < 0.05 only for illustration). Top, The color-coding scheme is as follows: red represents d2; green represents d3; blue represents d4; yellow represents d5. Phases corresponding to rest have been truncated. CS, Central sulcus; PoCS, postcentral sulcus.
