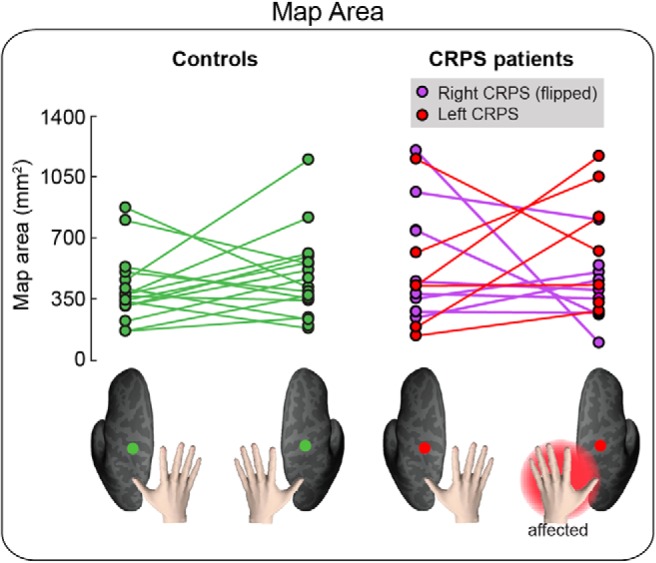
Figure 5.

Area of the hand map in S1. The area of the hand map (in mm2) in the left hemisphere and right hemisphere is plotted for each group and individual participant. To facilitate comparison, data from the two CRPS groups (right hand CRPS, left hand CRPS) were pooled, after flipping the data from one group (right hand CRPS) so that the affected side is always the left hand/right hemisphere in all patients.
