Figure 7.
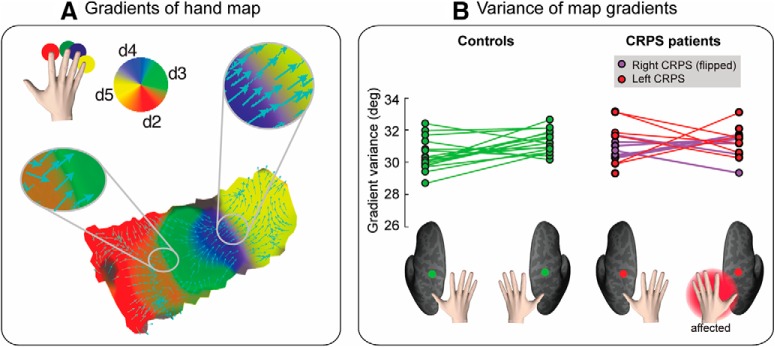
A, Gradients of the hand map. Gradients of a single-subject phase map are displayed as cyan arrows over a flattened (2D) cortical surface patch. The gradient points in the direction of the greatest rate of increase of the function (i.e., the direction of the phase shift in the hand map). Color-coding scheme of the hand map is as follows: red represents d2; green represents d3; blue represents d4; yellow represents d5. B, Variability of hand map gradients. The circular variance of map gradient directions is displayed for each participant and condition (side: left hemisphere, right hemisphere; group: controls, CRPS patients). Bottom, The color-coding scheme. To facilitate comparison, data from the two CRPS groups (right hand CRPS, left hand CRPS) were pooled, after flipping the data from one group (right hand CRPS) so that the affected side is the left hand/right hemisphere in all patients.

