Figure 1.
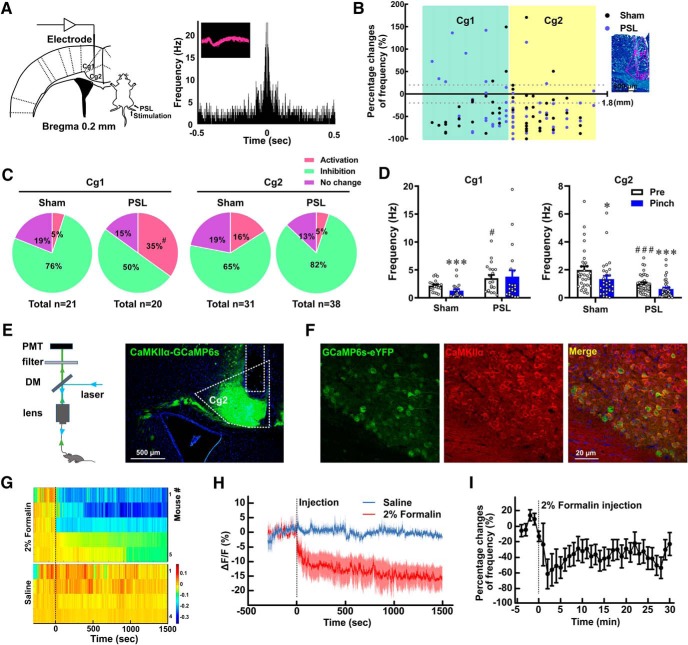
MCC Cg2Glu are inhibited by painful stimulation. A, Schematic drawing of the electrode placement in the left MCC, PSL surgery, and stimulation of the hindpaw on the right side (left), and the waveform and autocorrelation of a representative glutamatergic neuron (right). B, Mapping of the percentage changes of firing frequency of all recorded MCC (AP: 0.2 mm, ML: 0.3 mm) glutamatergic neurons in response to pinch stimulation and their corresponding depth relative to the brain surface in sham- and PSL-treated mice (left), and representative image of the electrode trace in the MCC (right). Scale bar, 500 μm. C, Proportion of MCC glutamatergic neurons that increased, decreased, and remained their firing frequency upon pinch stimulation in sham- and PSL-treated mice. For Cg1, Fisher's exact test, PSL versus sham, p = 0.047. D, Changes in firing frequency of MCC glutamatergic neurons in response to pinch stimulation in sham- and PSL-treated mice. Two-tailed unpaired t test for PSL versus sham, two-tailed paired t test for pinch versus pre. For Cg1: sham n = 21, pinch versus pre, p < 0.001, t = 5.316, df = 20. PSL n = 20, pinch versus pre, p = 0.7091, t = 0.3787, df = 19; PSL versus sham, p = 0.0335, t = 2.204, df = 39. For Cg2: sham n = 31, pinch versus pre, p = 0.0238, t = 2.380, df = 30. PSL n = 38, pinch versus pre, p < 0.001, t = 4.901, df = 37; PSL versus sham, p < 0.001, t = 3.681, df = 67. E, Schematic drawing of the fiber photometry setup (left) and photomicrograph showing the GCaMP6s-eYFP expression in MCC Cg2 (right). Scale bar, 500 μm. DM, Dichroic mirror; PMT, photomultiplier tube. F, Representative images showing the colocalization of GCaMP6s-eYFP in MCC Cg2 with CaMKIIα, a marker for glutamatergic neurons. Scale bar, 20 μm. G, Heatmaps of GCaMP6s fluorescence changes (ΔF/F) in MCC Cg2Glu in each individual mouse receiving saline or formalin injection in the contralateral hindpaw. H, Peri-event plot of GCaMP6s ΔF/F after saline or formalin injection (n = 4 and 5, respectively). I, Percentage change of firing frequency (time bin = 1 min) of MCC Cg2Glu after formalin injection. n = 11. G–I, Dashed lines indicate injection. *p < 0.05, ***p < 0.001, respectively, pinch versus pre; #p < 0.05 and ###p < 0.001, respectively, PSL versus sham.

