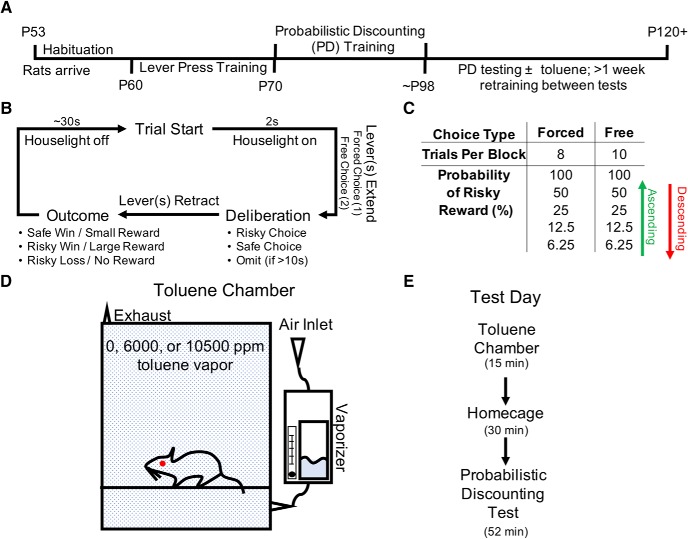
Figure 1.
Probabilistic discounting training and test design. A, Behavioral timeline and corresponding rat age. B, Flow chart detailing a single trial of the probabilistic discounting task. C, Breakdown of the 10 different behavioral blocks within the probabilistic discounting task. Odds were presented either in ascending or descending order. D, Toluene inhalation chamber schematic. E, Test day progression.

