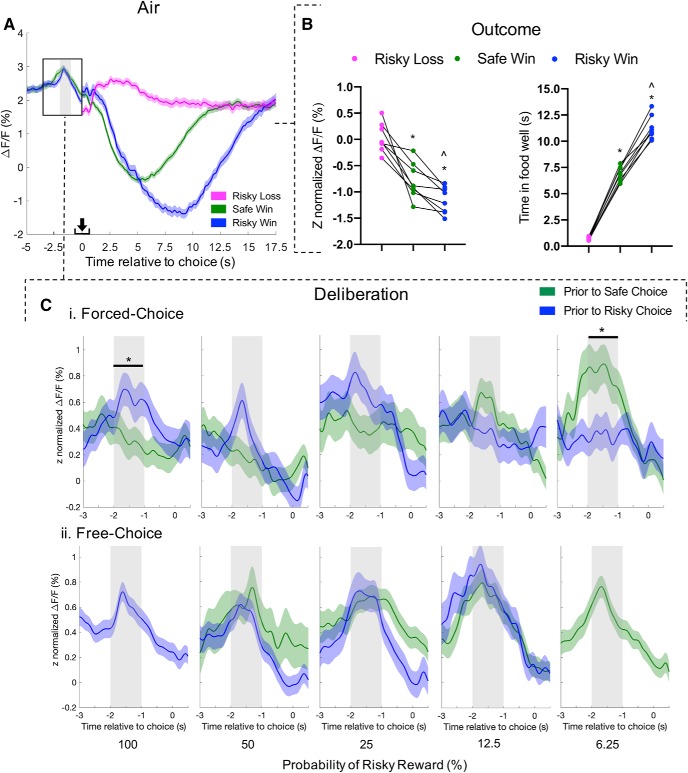
Figure 6.
PrL mPFC pyramidal activity tracks choice tracks choice selection and outcome during probabilistic discounting. A, Aggregate calcium response (8 rats; 1081 trials) during entire probabilistic discounting task from air-treated controls. Lines represent average ± SEM ΔF/F for safe choice/win (green), risky choice/win (blue), risky loss (pink). An increase in calcium activity was detected during deliberation, ∼1.5 s before choice (shaded column throughout figure). B, Average Z-normalized ΔF/F (left) and consumption time (right) during choice outcome for each rat with paired comparison: safe win versus risky win, ∧p < 0.05; risky loss versus safe win or risky win, *p < 0.05. C, Traces during deliberation were sorted on probability of rewarded risky choice (i.e., 100, 50, 25, 12.5, and 6.25%) and choice type (i.e., free and forced); aggregate Z-normalized mean ± SEM ΔF/F with average peaks summarized (right). Average calcium response during forced-choice (Ci; 443 traces, 8 rats) and free-choice (Cii; 560 traces, 8 rats). Summary traces exclude instances with <10 traces across <3 rats. Sidak's multiple comparison of mean value, safe versus risky choice, *p < 0.05. Arrow indicates moment of lever press.

