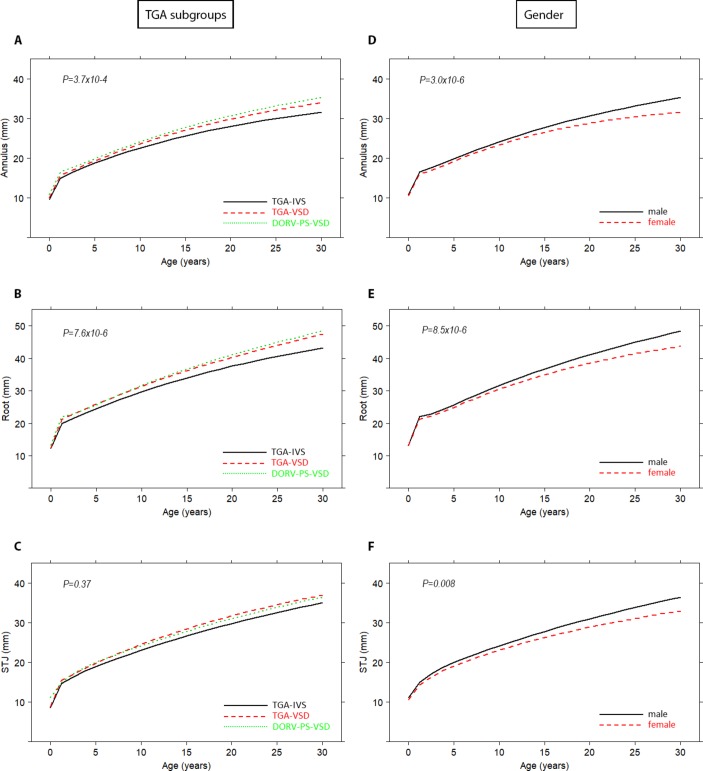
Figure 3.
Mean progression of neo-aortic dimensions over time for different TGA subtypes (A–C) and gender (D–F). Mean profiles are plotted with the described risk factors set to the reference level. For CIs (online supplementary figure S1). DORV-SP-VSD, double outlet right ventricle with subpulmonary ventricular septal defect; IVS, intact ventricular septum; STJ, sinotubular junction; TGA, transposition of the great arteries; VSD, ventricular septal defect.

