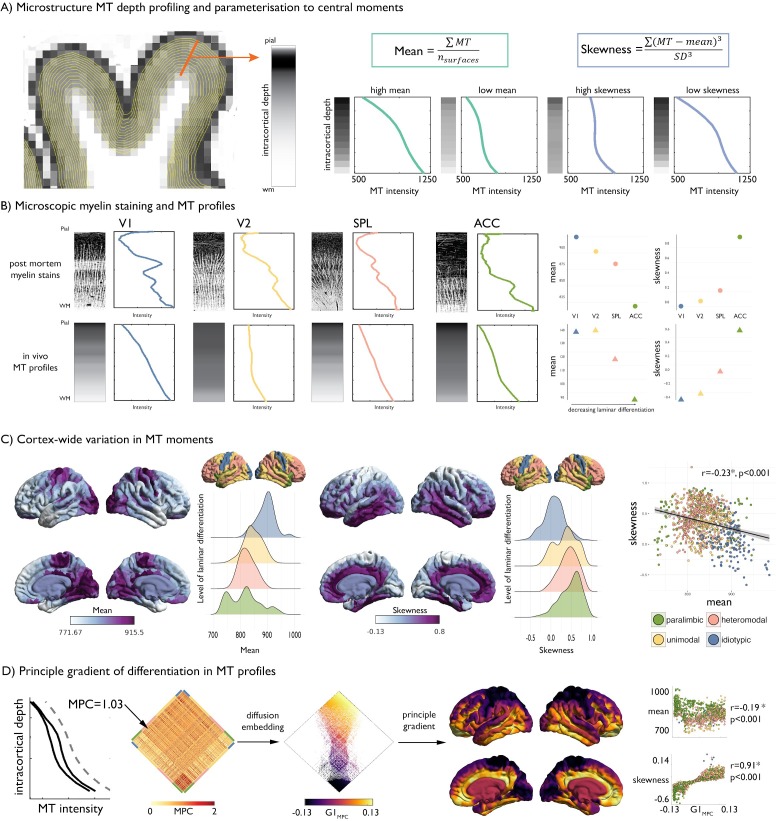
Figure 1. Intracortical MT depth profiling.
(A) Left. Equivolumetric surfaces overlaid on an MT image of a single subject, also showing an example vertex along which MT intensity is sampled (example MT profile in grey, with lighter tones represent higher MT intensity). Right. Schema of first and third moments. (B) Left. Examples of microscopic myelin-stained sections (inverted image shows myelin in lighter tones) (Vogt and Vogt, 1919; Vogt, 1911), with corresponding profiles and group-average MT profile from the same regions extracted in vivo. V1 = primary visual cortex. V2 = secondary visual area. SPL = superior parietal lobule. ACC = anterior cingulate cortex. Right. Dot-plots showing the moments for each exemplar profile. (C) Baseline group-average of first and third moment plotted on the cortical surface, and within levels of laminar differentiation (Mesulam, 2002; Paquola et al., 2019). The scatterplot shows the spatial overlap between first and third moment, coloured by level of laminar differentiation. Findings on the second and fourth moment are shown in Figure 1—figure supplement 1, and with an alternative cytoarchitectural taxonomy in Figure 1—figure supplement 2. (D) Microstructure profile covariance (MPC) was estimated between each pair of nodes based on the partial correlation of two nodes’ MT profiles (black), controlling for the cortex-wide mean intensity profile (grey dashed). Baseline MPC matrices were averaged across the group, and diffusion map embedding was employed to order regions according to the principal gradient of microstructural differentiation (G1MPC). Scatterplots show the relationship between node-wise loadings onto the principle gradient with MT moments.
Figure 1—figure supplement 1. Baseline properties of SD and kurtosis.


