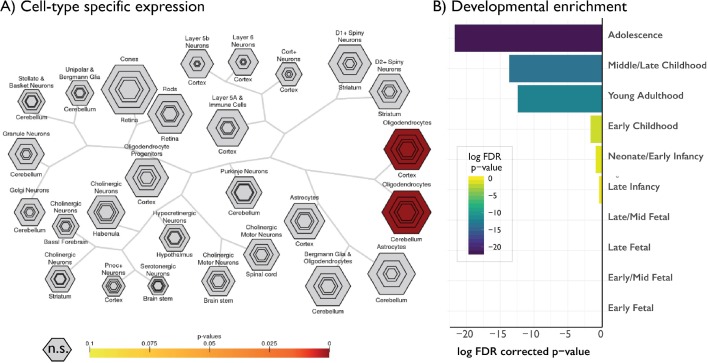
Figure 3. Gene decoding of age-related changes in skewness against the Allen Institute for Brain Sciences gene expression atlas.
Only genes negatively relating to age-related changes in skewness are shown as only these genes survived FDR < 0.05. No other moments had any significantly associated genes. Cell-type-specific expression, showing selective enrichment for oligodendrocytes, reinforcing the link between profile skewness and myelination. Hexagon rings denote significance at different pSI thresholds (from p<0.05 in the outer ring to 0.00001 in the centre). (B) Developmental cortical enrichment, showing enrichment specifically in adolescence and young adulthood.


