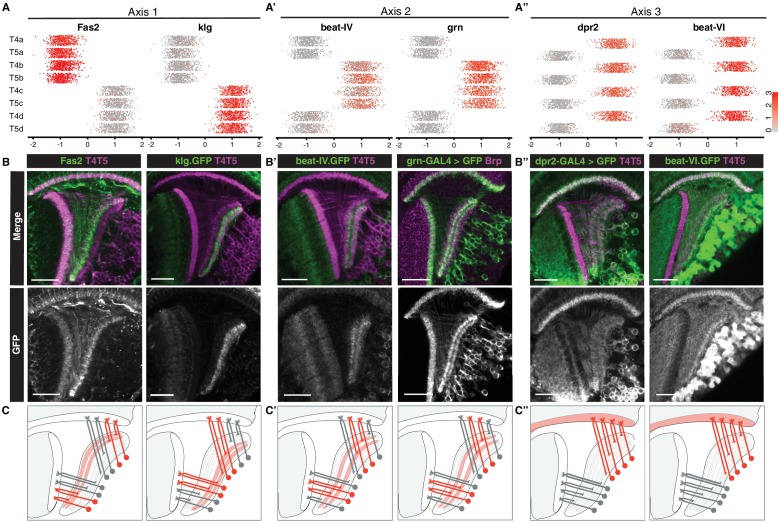
Figure 3. Primary axes of transcriptional diversity define groups of T4/T5 subtypes with shared wiring patterns.
(A–A”) 1-D scatterplots show distribution of cells along Axis 1, 2, and 3 for each cluster. Normalized expression levels are indicated by color, as in scale. (B–B”) In vivo expression of marker genes for each axis at 48 hr APF. Fas2 labels LoP layers a/b, klg labels LoP layers c/d, beat-IV and grn label LoP layers b/c, dpr2 and beat-VI label M10 but not Lo1. Scale bars, 20 μm. Sets of positive clusters in (A) are matched to specific sets of T4/T5 subtypes based on in vivo expression patterns in (B). Individual cluster identities are deduced based on combination of expression patterns. For example, T4a is Fas2+ (a/b), beat-IV- (not b/c), dpr2+ (M10). (C–C”) Schematic of wiring patterns of T4/T5 subtypes corresponding to the expression patterns of marker genes (red). See also Figure 3—figure supplement 1.


