. 2019 Nov 14;8:e50766. doi: 10.7554/eLife.50766

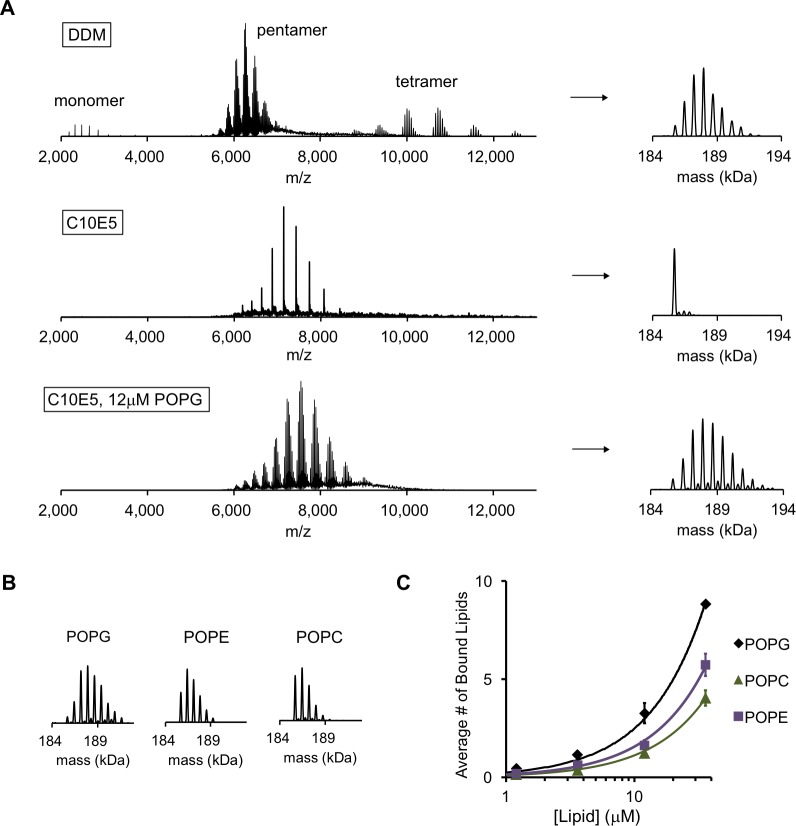
Figure 1. POPG binds selectively to ELIC.

(A) Native MS spectra of ELIC in DDM, C10E5, and C10E5 with 12 μM POPG. Left: full spectra; right: deconvoluted spectra. (B) Deconvoluted spectra of ELIC in 12 μM of the indicated phospholipid. (C) Plot of the average number of bound phospholipids per pentamer at varying concentrations of POPG, POPE, and POPC (n = 3–6, ± SD).

Figure 1.

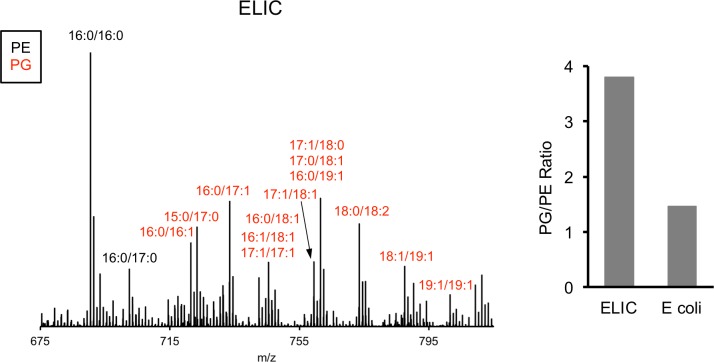
Figure 1—figure supplement 1. MS1 spectra of lipid extract from purified ELIC in DDM and E. coli membranes.

Figure 1—figure supplement 1.

Labeled peaks correspond to PG (red) and PE (black) phospholipids with specific acyl chain combinations determined from MS2 fragmentation. Right: Graph shows quantification of the intensity of all PG species relative to PE species for ELIC and E. coli membrane samples.
Figure 1—figure supplement 2. Representative deconvoluted spectra of 1 μM ELIC in C10E5 with increasing concentration of POPG.
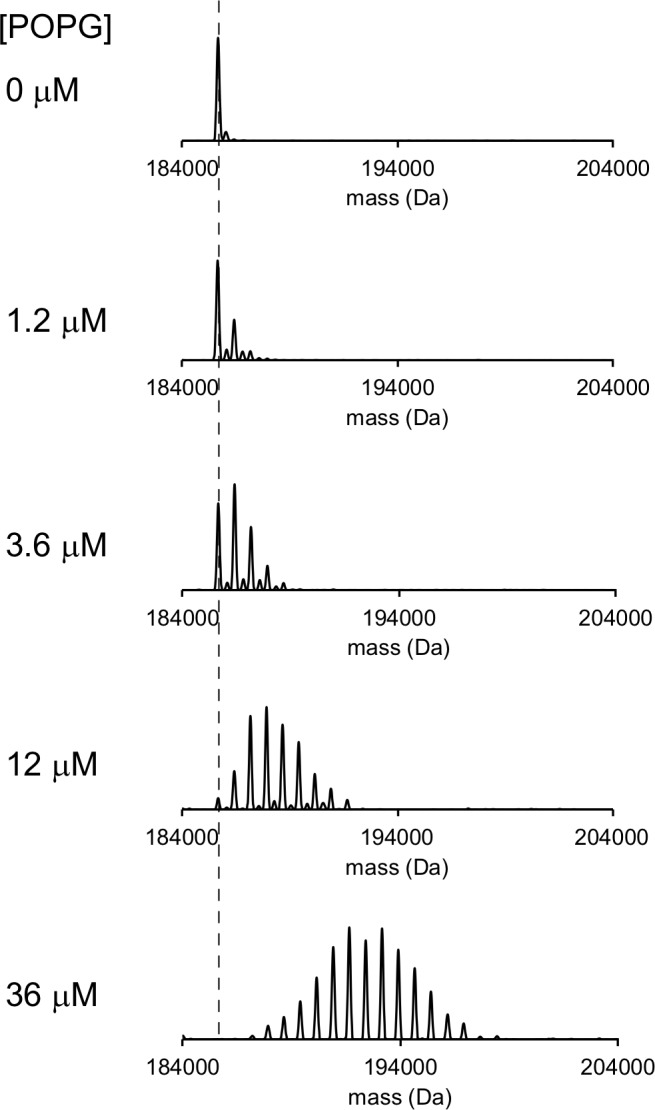
Figure 1—figure supplement 2.

Dashed line indicates mass of apo ELIC.
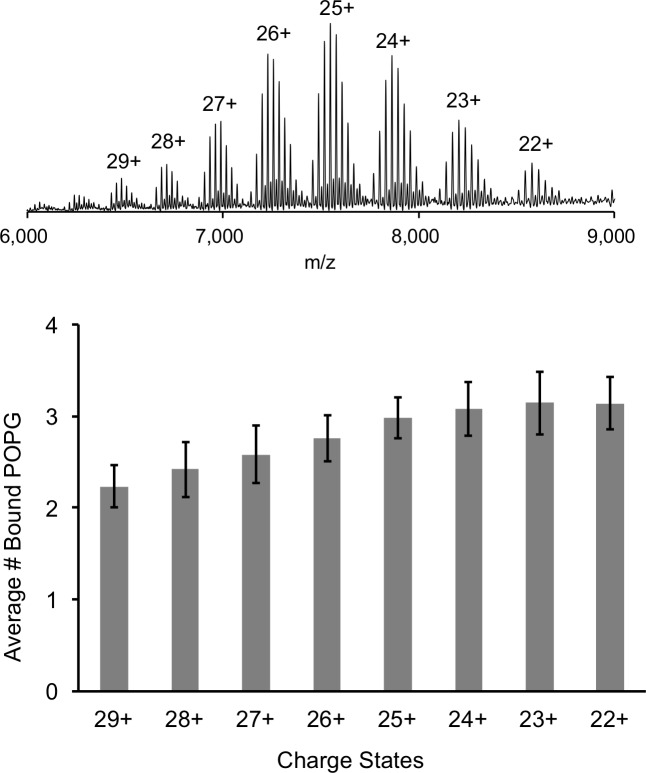
Figure 1—figure supplement 3. Comparison of lipid binding at different charge states.

Figure 1—figure supplement 3.

Top: Representative full native spectrum of the ELIC pentamer with 12 μM POPG with each charge state labeled. Bottom: Quantification of the average number of bound POPG to the ELIC pentamer at each charge state (n = 13, ± SD).
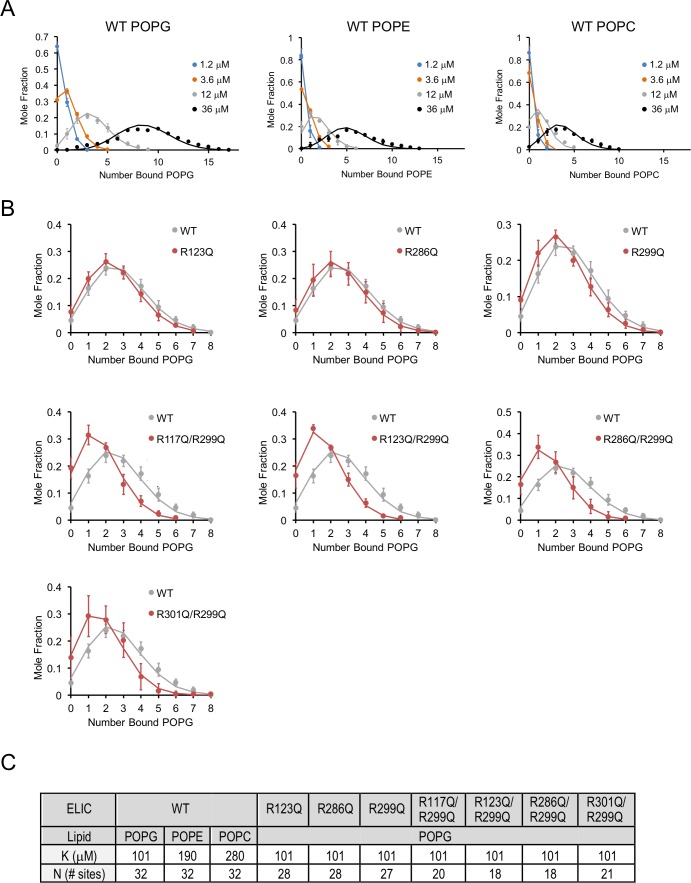
Figure 1—figure supplement 4. Lipid binding data fit to binomial distributions.

Figure 1—figure supplement 4.

(A) Plots of mole fraction of phospholipid-bound ELIC derived from native MS experiments with varying concentrations of phospholipid (circles, n = 3–6, ± SD). Solid lines show global fits from a binding model based on a binomial distribution with 32 sites (N) of equal affinity (K) using K as shown in (C). (B) Plots of mole fraction of POPG-bound ELIC WT and mutants at 12 μM POPG (circles, n = 3–6, ± SD). Solid lines show fits as in (A) in which K is held constant at 102 μM and N is varied as indicated in (C). (C) Table showing dissociation constants (K) and number of sites (N) used in fits shown in (A) and (B).