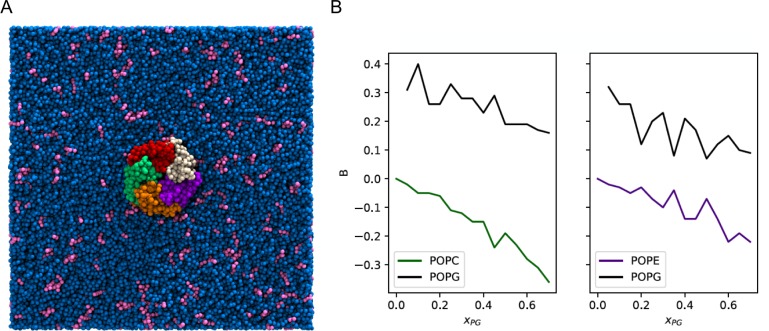
Figure 2. Enrichment of POPG among ELIC boundary phospholipids from coarse-grained simulations.
(A) Image of the simulation model of ELIC embedded in a membrane consisting of 10% POPG (pink) and 90% POPC (blue). The view is from the extracellular side of ELIC perpendicular to the membrane. (B) The boundary enrichment metric, B, is shown for phospholipid species in POPC/POPG membranes (left) or POPE/POPG membranes (right) over a range of POPG mole fractions (). B is defined in Equation 8 (see Materials and methods) and reflects the fractional difference between the amount of a lipid species found in the boundary and the bulk membrane: B > 0 indicates enrichment, B < 0 indicates depletion, and B = 0 indicates no difference in mole fraction between the bulk and the boundary.

