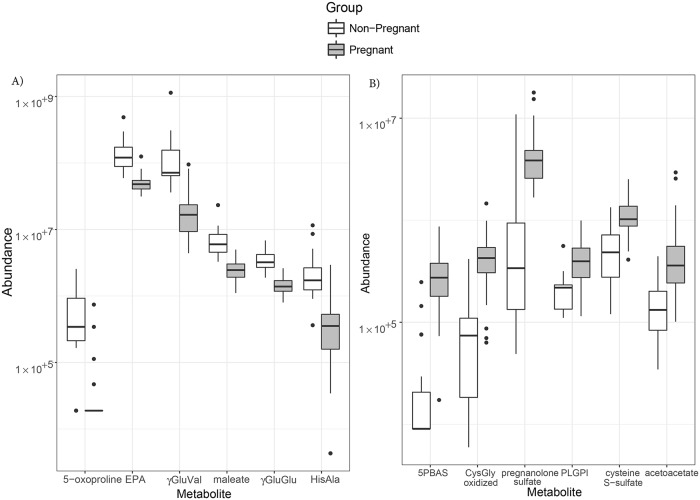
Fig 2. Boxplots of small-molecule abundance as a function of pregnancy status.
The distribution of metabolites with increased (A) or decreased (B) abundance are shown using boxplots; the thick lines represent the medians, the boxes represent inter-quartile ranges, and the whiskers extend to the minimum/maximum values if not more than 1.5 times the interquartile range. EPA = eicosapentaenoate; γGluVal = γ-glutamyl valine; γGluGlu = γ-glutamyl glutamate; HisAla = histidylalanine; 5PBAS = 5α-pregnan-3β,20α-diol monosulfate; PLGPI = palmitoyl-linoleoyl-glycerophosphoinositol; CysGly, oxidized = glycine-cysteine-(SS)-cysteine-glycine.

