FIGURE 2.

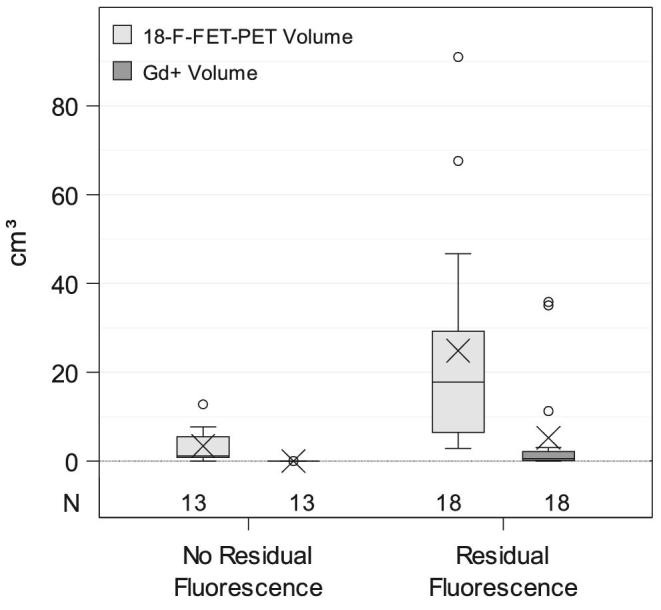
Boxplots showing the distribution of 18F-FET-PET and Gd+ tumor volumes according to residual or no residual intraoperative fluorescence noted at the end of the operation. An X denotes the mean.

Boxplots showing the distribution of 18F-FET-PET and Gd+ tumor volumes according to residual or no residual intraoperative fluorescence noted at the end of the operation. An X denotes the mean.