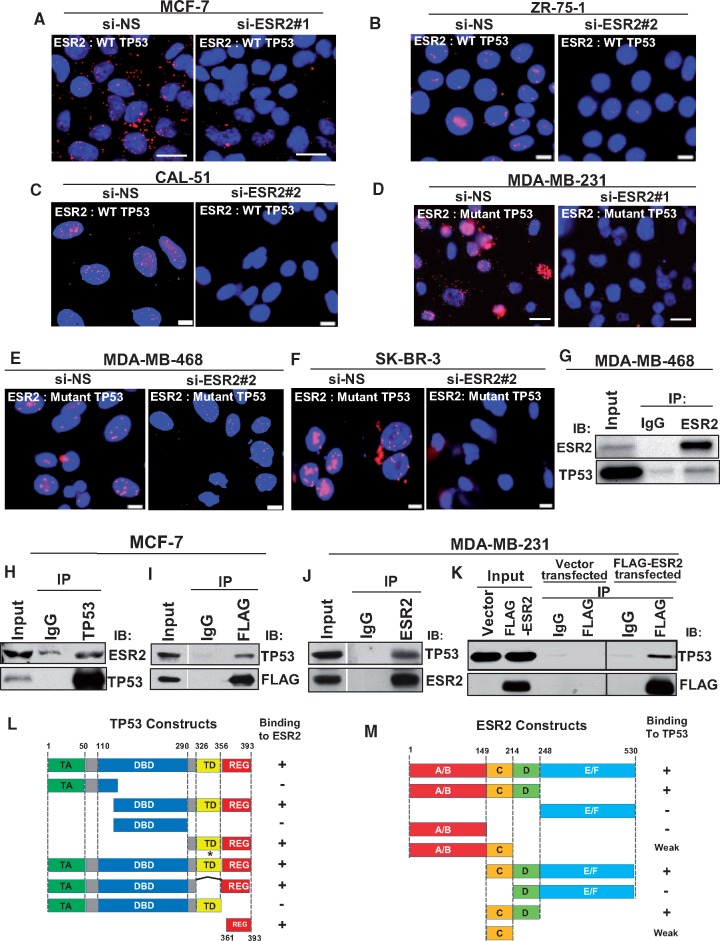
Figure 1.
Interaction of estrogen receptor-beta (ESR2) with both wild-type (WT) and mutant TP53. A–F) ESR2-TP53 interaction was analyzed by proximity ligation assay (PLA) in (A) MCF-7, (B) ZR-75-1, (C) CAL-51 (cell lines expressing endogenous WT TP53), (D) MDA-MB-231, (E) MDA-MB-468, and (F) SK-BR-3 (cells expressing endogenous mutant TP53). Cells were transfected with either control (non-specific siRNA [si-NS]) (left panels) or ESR2-specific siRNA (si-ESR2) (right panels) for 48 hours. Interaction assayed by PLA is noted in white font (inset). Scale bar for Figure 1A and D = 20 μm; scale bar for Figure 1B, C, E, and F = 10 μm. G–K) Co-immunoprecipitation (Co-IP) of endogenous ESR2 and WT TP53 was performed in G) MDA-MB-468 and in H) MCF-7, followed by immunoblotting with TP53 and ESR2 antibodies. I) Co-IP of endogenous TP53 and exogenously expressed FLAG-ESR2 was performed in MCF-7 cells, followed by immunoblotting with TP53 and FLAG antibodies. J) Co-IP of endogenous ESR2 and WT TP53 in MDA-MB-231 cells was performed, followed by immunoblotting with TP53 and ESR2 antibodies. K) Co-IP of endogenous TP53 and exogenously expressed FLAG-ESR2 in MDA-MB-231cells was performed with TP53 antibody, followed by immunoblotting with TP53 and FLAG antibodies. L) Schematic diagram of WT and truncated mutant TP53 proteins and their ability to bind ESR2 in a Glutathie S-Transferase. (GST) pull-down assay. (See also Supplementary Figure 3A–C, available online.) TA = transactivation domain; DBD = DNA binding domain; TD = tetramerization domain; REG = regulatory domain; * = point mutation; − = no binding; + = strong binding; Numbers = position of amino acid residues. M) Schematic diagram of WT and truncated mutant ESR2 proteins and their ability to bind TP53 in a GST pull-down assay. (See also Supplementary Figure 3, D and E, available online). A/B = activation function 1 (AF1); C = DNA binding domain (DBD); D = hinge region; E/F = activation function 2 (AF2)/Ligand binding domain (LBD) = glutatione S-transferase.

