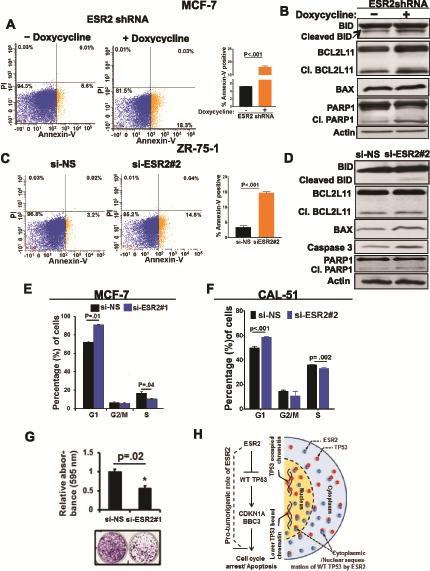
Figure 3.

Effect of estrogen receptor-beta (ESR2) on cell proliferation in the wild-type (WT TP53 context. A) Apoptosis in MCF7shESR2 stable cells treated with or without 1 µg/mL doxycycline (to induce ESR2 shRNA) for 48 hours was analyzed by flow cytometry after double-staining with Annexin V-FITC and propidium iodide (PI). Bar graph (right panel) shows fold change of Annexin +/PI – cells. B) Expression of active apoptosis markers: cleaved BID, cleaved BCL2L11, BAX, and cleaved PARP1 proteins in MCF-7ESR2 shRNA stable cells with or without 1 μg/mL doxycycline for 48 hours to induce ESR2 shRNA expression was analyzed by immunoblotting. C) Apoptosis in ZR-75-1 cells following ESR2 #2 siRNA knockdown for 48 hours was analyzed by flow cytometry after double-staining the cells with Annexin V-FITC and PI. Bar graph (far right panel) shows fold change of Annexin +/PI – cells. D) Expression of active apoptosis markers: cleaved BID, cleaved BIM, BAX, and cleaved PARP proteins in ZR-75-1 with or without ESR2 #2 siRNA knockdown for 48 hours was analyzed by immunoblotting. E) Quantification of flow cytometry analysis of MCF-7 cells stained with PI for cell cycle distribution, with or without knockdown with ESR2 #1 siRNA for 48 hours. F) Quantification of flow cytometry analysis of CAL-51 cells stained with PI for cell cycle distribution, with or without knockdown with ESR2 #2 siRNA for 48 hours was performed. G) MCF-7 cells with or without knockdown with ESR2 #1 siRNA were subjected to clonogenic assay. Top panel: Bar graph shows quantification of average absorbance of three independent experiments. Bottom panel: Representative image of colonies stained with crystal violet are shown. H) A model for the pro-tumorigenic role of ESR2 in the WT TP53 setting is shown. Showing two prototypic TP53-targets, CDKN1A and BBC3, does not imply these are the only proteins participating in the ESR2-TP53 signaling crosstalk. All P values were determined by two-tailed Student t test. Error bars represent SD. si-NS = non-specific siRNA; siESR2 = ESR2-specific siRNA; Cl. BCL2L11 = cleaved BCL2L11; Cl. PARP1 = cleaved PARP.
