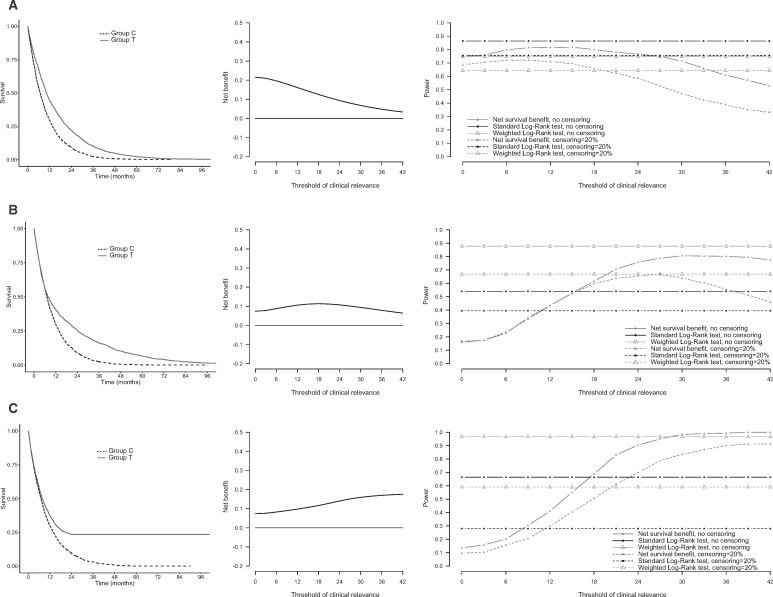
Figure 2.
Survival benefits in three scenarios of proportional hazards or nonproportional hazards. Survival benefits in a scenario of proportional hazards (A) and two scenarios of nonproportional hazards (delayed treatment effect [B] and cure rate [C]). Left panels: Kaplan-Meier estimates of survival functions over time. Middle panels: net survival benefit of at least months. Right panels: power of the standard log-rank test, weighted log-rank test, and of the test of a net survival benefit of at least months. Powers are plotted for two situations: no censoring (solid lines) and administrative censoring of 20% (dotted lines). Group C = control group; Group T = treatment group.

