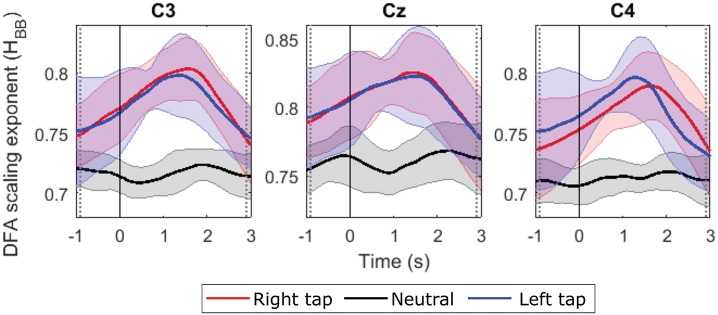
Figure 2.
The grand average time evolution of Hurst exponents of broadband EEG (H quantifying LRTC). The progressions of grand average H in all the participants in channels C3, Cz, and C4 during right finger tap (red), left finger tap (blue), and resting state (black). The LRTC increases during movement intention and execution. The movement onset is at 0 s, marked by a solid vertical line. The H of movement trials is significantly different from the H of resting state trials in the time region between the dotted gray vertical lines (p < 0.05). The shaded areas show the standard deviation.

