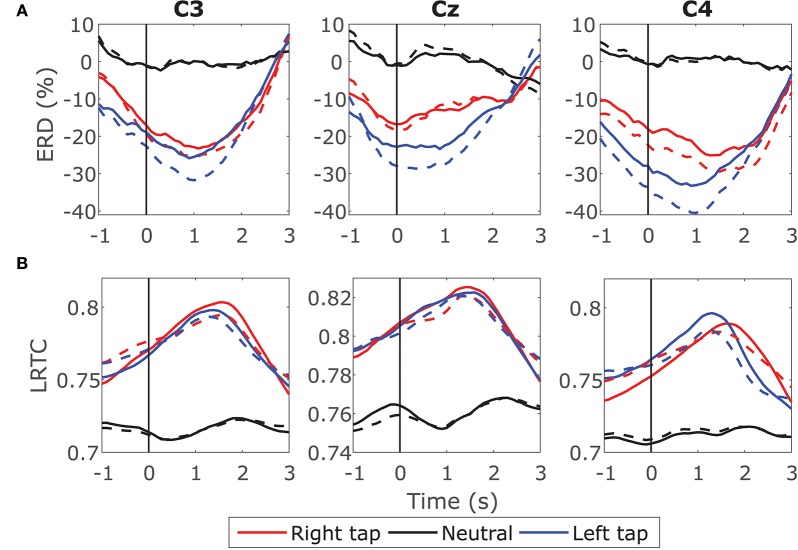
Figure 5.
Effect of LRTC on ERD and effect of ERD on LRTC. (A) Solid lines show the time progression of grand average ERD calculated from EEG containing LRTCs in the right finger tap (red), left finger tap (blue), and resting state (black) trials from all the participants. The dotted lines represent the ERD after removing LRTCs from the broadband EEG by fractionally differencing it by d. The movement onset is at 0 s shown by a solid vertical line. Both the ERDs during movement are significantly different from the resting state (p < 0.05). ERDs with and without LRTCs are not significantly different. (B) Solid lines show the time progression of grand average LRTC calculated from EEG containing ERD in right tap, left tap and resting state. The dotted lines represent the LRTC after removing ERD from the broadband EEG by fixing the 8–13 Hz power. Both the LRTCs during movement are significantly different from the resting state (p < 0.05). LRTCs with and without ERD are not significantly different from each other. LRTC and ERD do not have a significant effect on each other because removing one does not change the values of the other.

