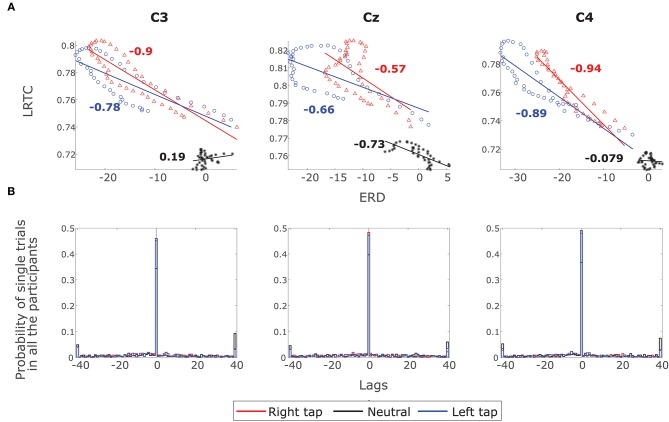
Figure 6.
The correlation between ERD and LRTC. (A) Scatter plot shows a strong inverse correlation between ERD and LRTC during right (red) and left (blue) finger tapping in channels C3, Cz, and C4. There is no correlation between ERD and LRTC during resting state (black). The correlation coefficients are shown beside the fitted straight lines. (B) The distribution of lags with maximum cross-correlation between LRTC and ERD in single trials of all the participants in all the three conditions. The LRTC and ERD have maximum correlation at lag 0.

