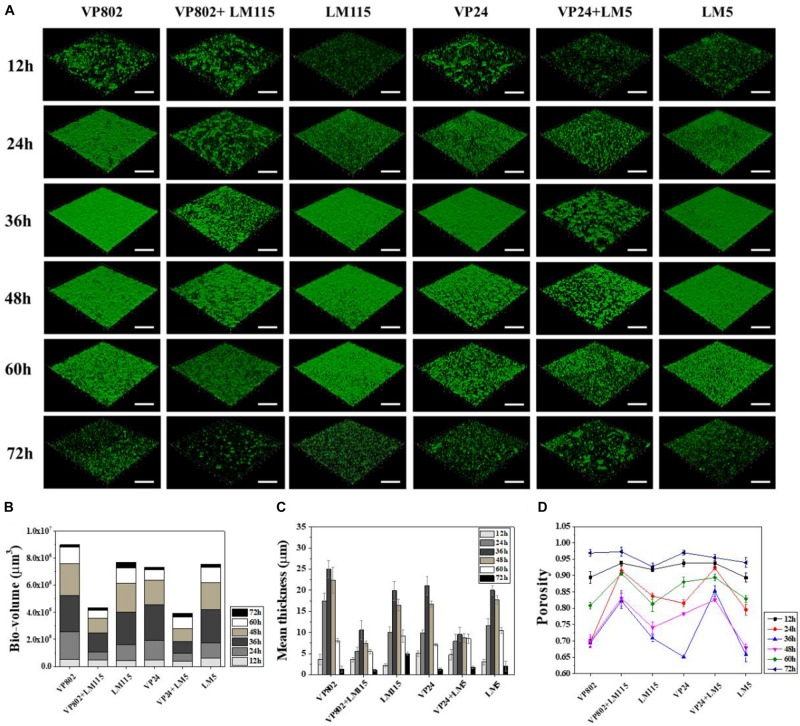
FIGURE 2.
Biofilm developments of single- and mixed- species monitored by CLSM. (A) CLSM images (captured under the 20õ objective) showing the mono- and mixed-species biofilms formed by V. parahaemolyticus (VP802, VP24) and L. monocytogenes (LM115, LM5) after 12, 24, 36, 48, 60, and 72 h cultivation, respectively. Scale bar: 50 μm. Quantification of structural parameters in biofilm based on the CLSM images using ISA2 software: (B) Bio-volume, (C) Biofilm mean thickness, (D) Biofilm porosity. Error bars represent standard deviation of three biological replicates.

