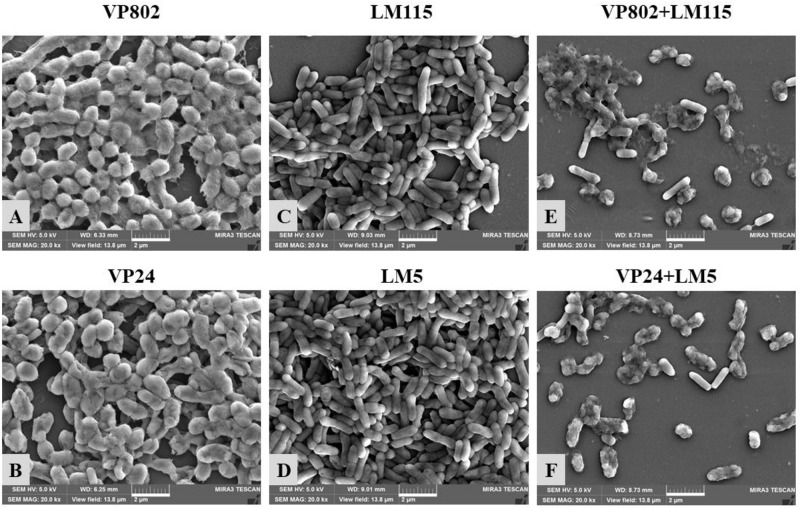
FIGURE 3.
Scanning electron microscopy (SEM) images of mono- and mixed-species biofilms formed by V. parahaemolyticus and L. monocytogenes. Scale bar represented 2 μm. Pictures were representative of three independent experiments with three replicates each. (A) V. parahaemolyticus VP802; (B) V. parahaemolyticus VP24; (C) L. monocytogenes LM115; (D) L. monocytogenes LM5; (E) Mixed-species VP802+LM115; (F) Mixed-species VP24+LM5.

