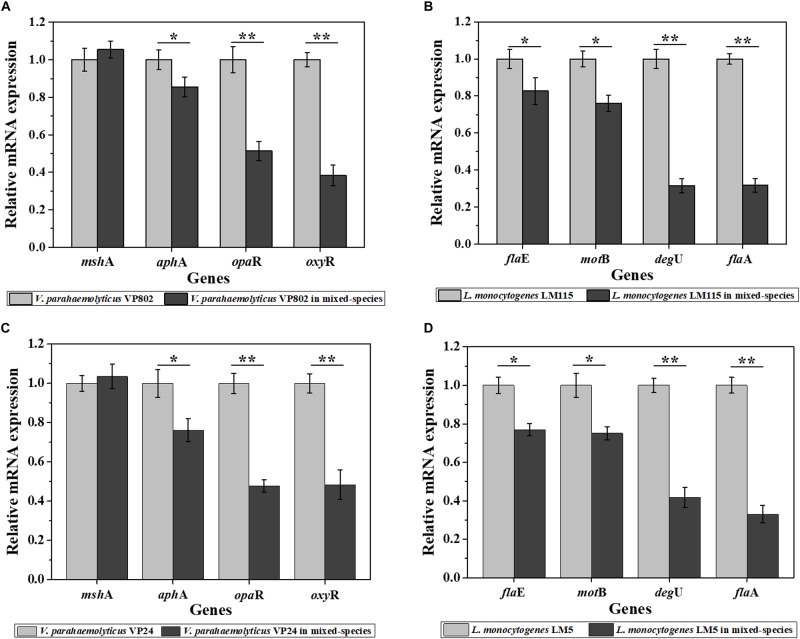
FIGURE 5.
Relative expression levels of genes involved in the regulation of biofilm formation of V. parahaemolyticus VP802 (A), L. monocytogenes LM115 (B), V. parahaemolyticus VP24 (C), and L. monocytogenes LM5 (D). The light gray bars represent mono-species biofilm and dark gray bars represent mixed-species biofilms. Error bars represent the standard deviation of triplicate experiments. ∗p < 0.05; ∗∗p < 0.01.

