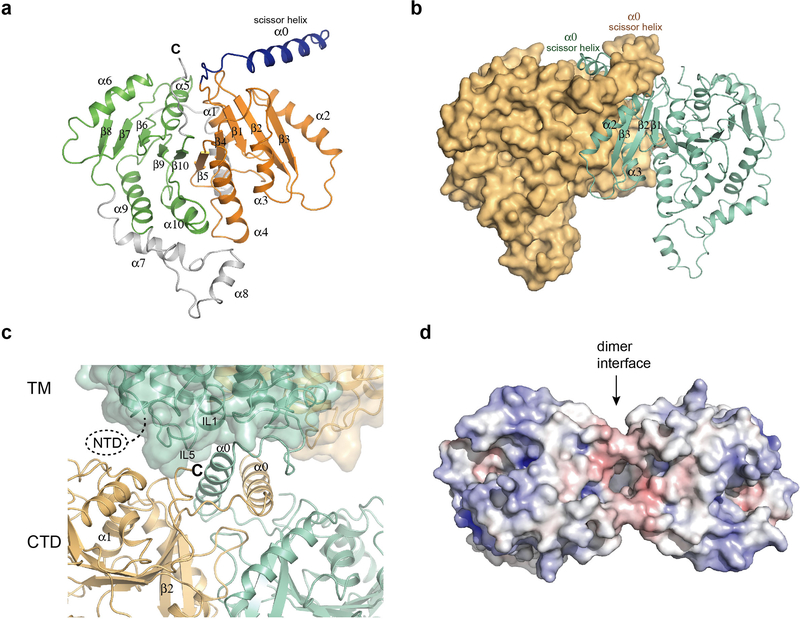
Extended Data Figure 5 |. Structure of soluble domain.
a, A single subunit of the NKCC soluble domain in ribbon representation. The N- and C-terminal halves of the CTD that show a similar structure are coloured in green and orange, respectively. b, The dimer of the soluble domain. One subunit is shown as a surface and the other is shown as a ribbon. c, Close-up view of the TM and soluble domain interface. Two subunits are coloured in dark green and gold, respectively. The TM domain is shown as a surface representation and the soluble domain as a ribbon representation. The NTD and the C-terminal end of the protein are located at the interface. d, The intracellular surface of the TM domain. The surface is coloured according to electrostatic potential (red, −10 kT e−1; blue, +10 kT e−1).

