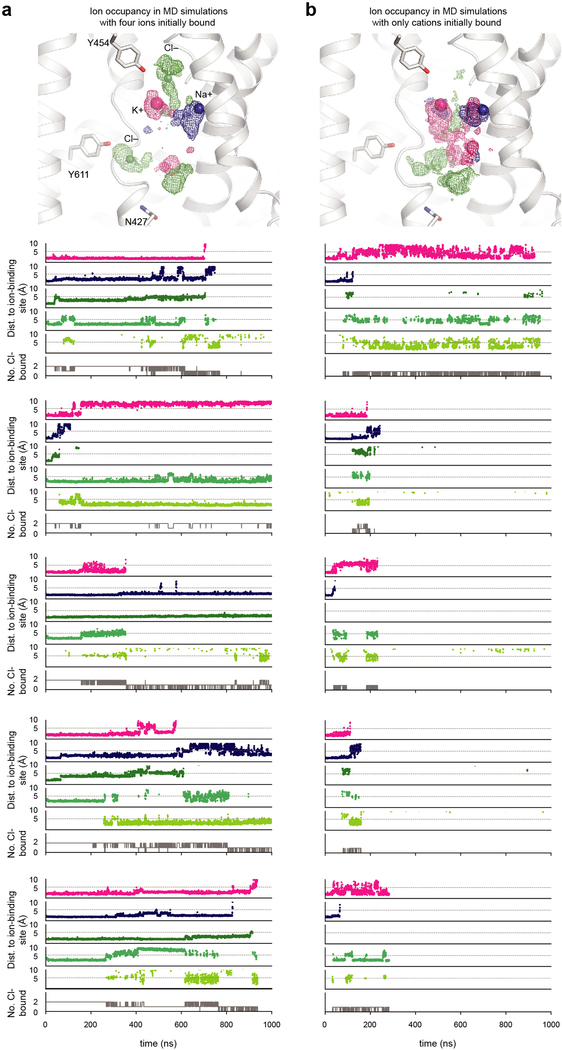
Extended Data Figure 7 |. Molecular dynamics simulations.
a, Ion probability densities of ions within translocation pathway (top) and individual traces (bottom) for all simulations performed with K+, Na+, and Cl– initially present in the translocation pathway. b, Ion probability densities of ions within translocation pathway (top) and individual traces (bottom) for all simulations performed with only K+ and Na+ initially present in the translocation pathway. In the latter set of simulations, Cl– spontaneously explores regions that form stable chloride-binding sites. Probability density maps were calculated as described in Methods. The top four simulation traces represent the minimum distance of an ion of a particular type from the pre-determined centre of each binding site (see Methods). The bottom simulation trace shows the number of Cl− ions bound within any of the three chloride-binding sites at once.

