
Figure 2.
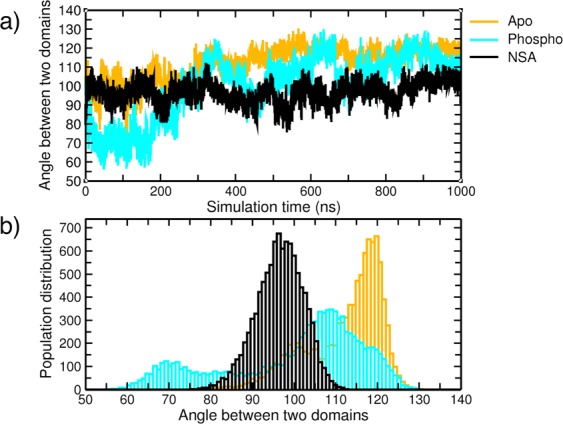
(a) represents calculated angle between the 4HB and the PsK domain (as shown in Fig. 1) for apo, phospho and NSA bound MLKL simulations. (b) Shows the histogram of the top panel plot showing population distributions based on angle.
Official websites use .gov
A
.gov website belongs to an official
government organization in the United States.
Secure .gov websites use HTTPS
A lock (
) or https:// means you've safely
connected to the .gov website. Share sensitive
information only on official, secure websites.
(a) represents calculated angle between the 4HB and the PsK domain (as shown in Fig. 1) for apo, phospho and NSA bound MLKL simulations. (b) Shows the histogram of the top panel plot showing population distributions based on angle.