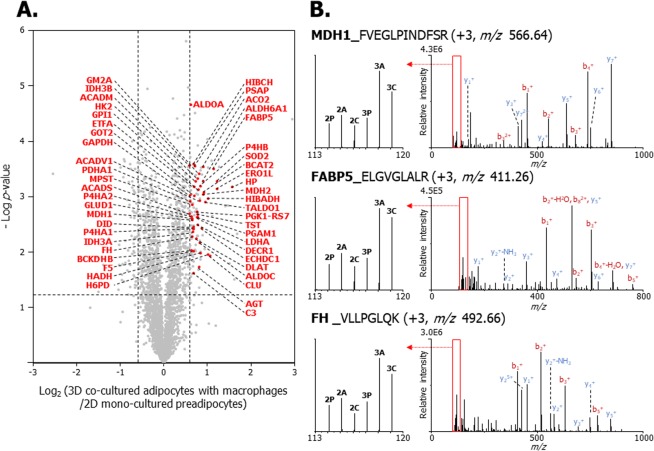
Figure 7.
Volcano plot and MS/MS spectra of up-regulated proteins expressed in 3D co-cultured adipocytes with macrophages (3C) versus 2D mono-cultured preadipocytes (2P). (A) Volcano plot of quantified proteins between 3C and 2P illustrates the log2 3C/2P iTRAQ ratio (x-axis) and –log p-value (y-axis). The non-axial vertical lines indicate ±1.5-fold change, and the non-axial horizontal line indicates p = 0.05, which is the statistical threshold for measuring differentially expressed proteins. The 48 proteins denoted in red among 124 up-regulated proteins were included in the cluster. (B) MS/MS spectra of MDH1 (FVEGLPINDFSR), FABP5 (ELGVGLALR) and FH (VLLPGLQK), which are involved in glycolysis/gluconeogenesis, TCA cycle, and fatty acid metabolism. Left spectra indicate the iTRAQ reporter ions. 2P, 114.11; 2D mono-cultured adipocyte (2A), 115.11; 2D co-cultured adipocytes with macrophages (2C), 116.11; 3D mono-cultured preadipocytes (3P), 117.11; 3D mono-cultured adipocyte (3A), 118.11; 3C, 119.11.

