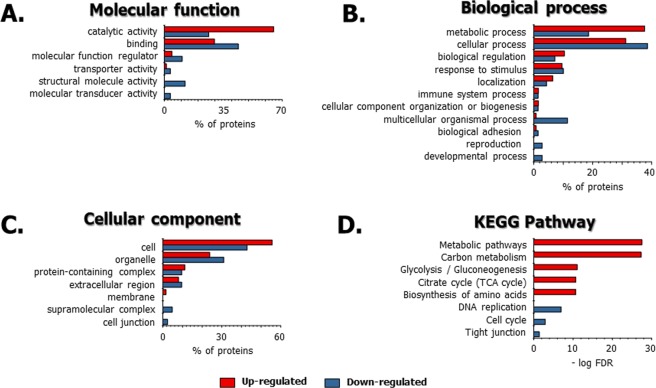
Figure 8.
Functional annotations of up-regulated and down-regulated proteins in 3D co-cultured adipocytes with macrophages compared to those in the 2D mono-cultured adipocytes using the PANTHER classification system and STRING. (A) Molecular function, (B) biological process, (C) cellular component, (D) KEGG pathway. For the classification of quantified proteins, 124 up-regulated and 67 down-regulated proteins from a total of 2,885 quantified proteins were used. The red and blue rods show the percentage (%) and –log FDR value of up-regulated and down-regulated proteins, respectively. The KEGG pathways for the up-regulated and down-regulated proteins are listed in Supporting Table 2.

