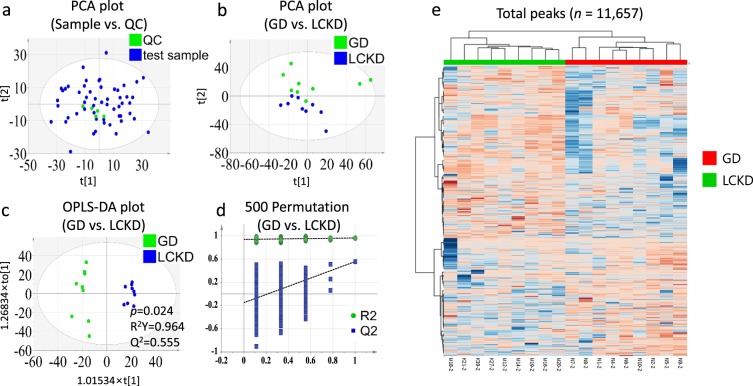
Figure 2.
PCA score plot, OPLS-DA three-dimensional score plots and validation plot for the metabolic profiling results between GD and LCKD (week 2). PCA score plots compared (a) sample and QC and (b) GD and LCKD groups at week 2. (c) OPLS-DA score plot (three latent variables, p = 0.024, R2Y = 0.964, Q2 = 0.555) and (d) the 500-permutation plot validated GD versus LCKD in the ESI+ mode. All permuted R2 and Q2 values on the left were lower than the point on the right and the Q2 regression line had a negative intercept. (R2 = 0.933959, Q2 = −0.174472). (e) The total peak intensities between GD and LCKD at week 2 are visualized with a hierarchical cluster analysis heat map. OPLS-DA, orthogonal partial least squares discriminant analysis; PCA, principal component analysis; QC, quality control.

