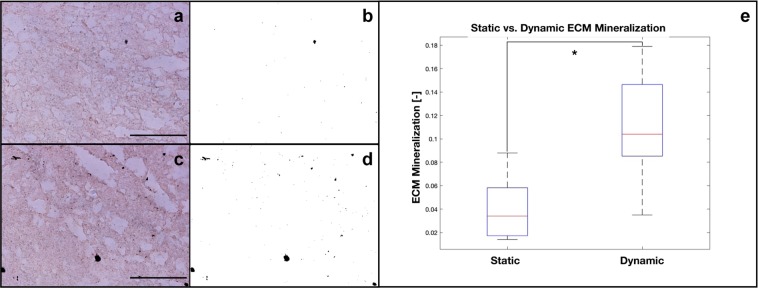
Figure 6.
Optical microscopy images of ECM mineralization (Von Kossa staining) within the core of the 3D CHT/G scaffold under either static (a) or dynamic (perfusion and compression) (c). Corresponding maximum entropy threshold-based image segmentation is also shown (b,d). Quantitative analysis of the total amount of scaffold area covered by the von Kossa black spots is shown (e). *Statistically significant difference (Student’s t-test; p < 0.05). Scale bar = 250 μm.

