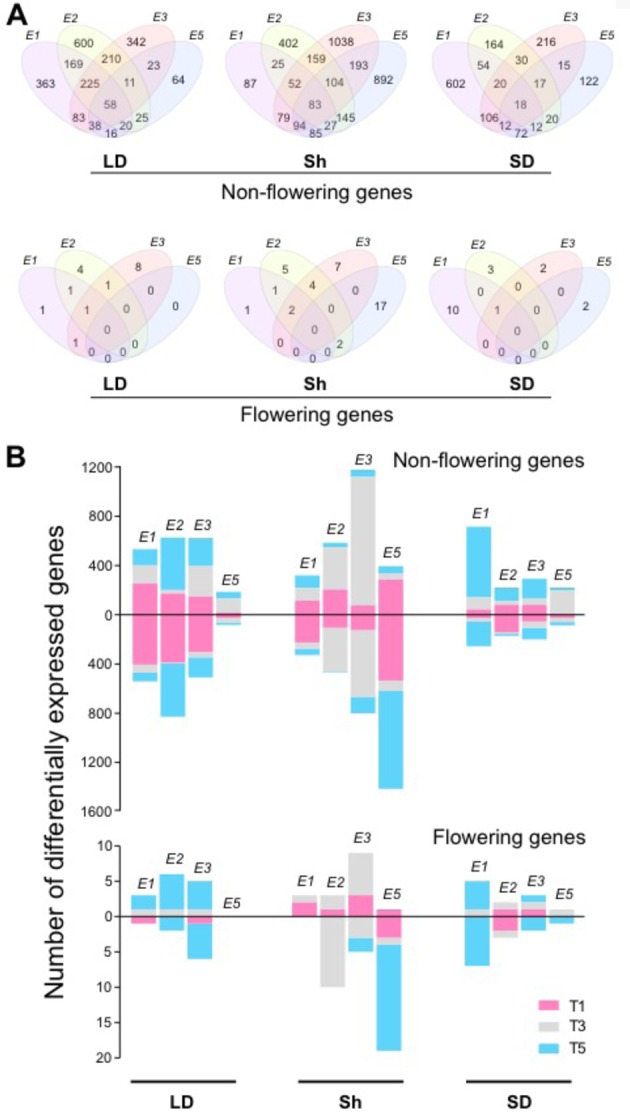
Figure 2.

The effects of E loci in genome-wide gene expression. (A) Venn diagrams indicating the overlaps between E1, E2, E3, and E5 in differentially expressed non-flowering genes (top) and flowering genes (bottom) under the control of the E loci under long day (LD), shift (Sh), and short day (SD). (B) Numbers of differentially expressed non-flowering genes (top) and flowering genes (bottom) under the control of E1, E2, E3, and E5 at the time points T1 (pink), T3 (gray), and T5 (blue) under LD, shift (Sh), and SD. The bars above 0 represent upregulated genes, and the bars below 0 represent downregulated genes.
