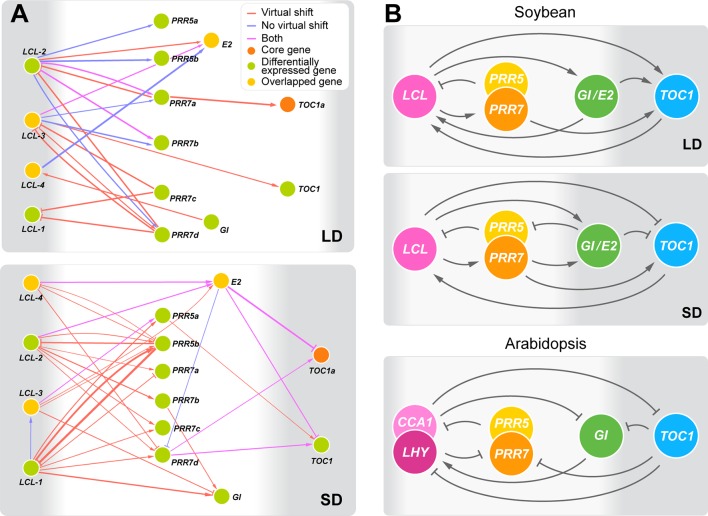
Figure 3.
The predicted circadian clock gene networks in soybean. (A) Predicted regulatory interactions among the 14 circadian clock gene homologs in the 74 candidate flowering genes (weight ≥ 0.2) under long day (LD) and short day (SD) with or without a virtual time shift that captures regulatory interactions that may occur during the night between time points T5 and T1. The thickness of edges represents confidence levels. Arrowheads and perpendicular lines illustrate induction and repression of transcriptional activity, respectively. (B) The outlined predicted circadian clock gene networks in soybean under LD and SD in comparison with the circadian clock gene network in Arabidopsis (Sanchez and Kay, 2016). Arrowheads and perpendicular lines illustrate induction and repression of transcriptional activity, respectively.

