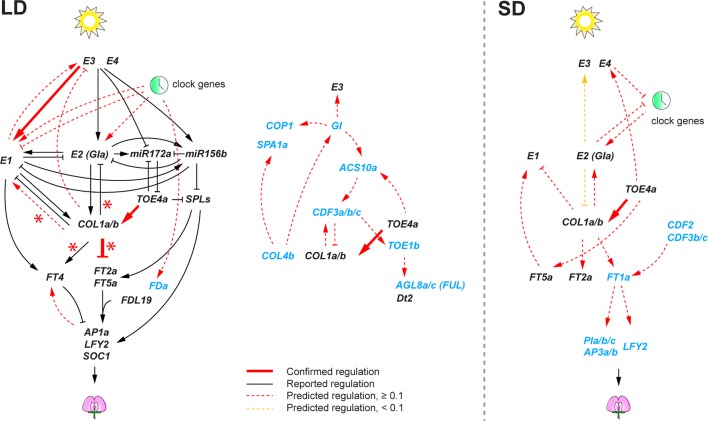
Figure 4.
The soybean flowering gene networks consisting of reported regulatory interactions in literature and predicted regulatory interactions under long day (LD) and short day (SD). Predicted regulatory interactions are obtained using the 74 candidate flowering genes with virtual shift. Genes shown in black are previously characterized genes in literature, and genes in blue are differentially expressed genes under E loci. Reported interactions are shown as solid edges, and predicted interactions are shown as red dotted or solid edges (weight ≥ 0.1). Red solid edges indicate predicted interactions that are confirmed in reported regulatory interactions in literature. Red asterisks indicate regulatory interactions confirmed in GmCOL1- and GmCOL2-RNAi transgenic plants. Yellow dotted edges indicate less significant edges (weight < 0.1) in the 74 flowering genes but notably significant (weight ≥ 0.6) when the 22 core flowering genes are used for network prediction. Arrowheads and perpendicular lines illustrate induction and repression of transcriptional activity, respectively.

