Figure 2.
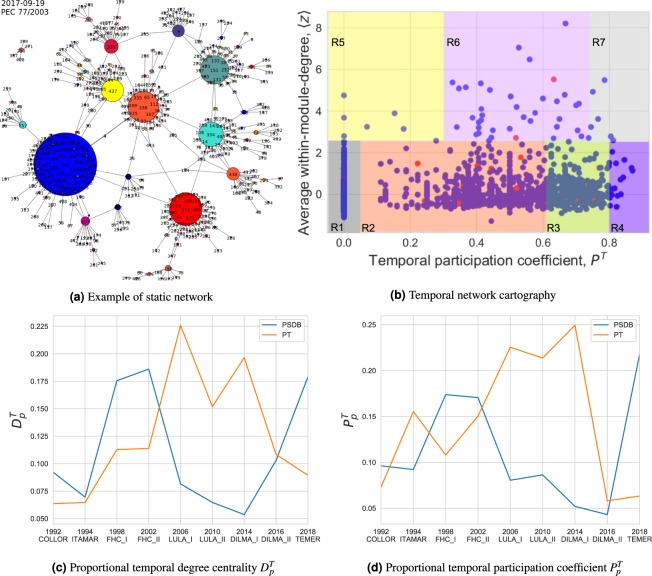
(a) Example of a static network generated by our algorithm for the voting session occurred on 2017-09-19 of legislative bill PEC 77/2003. Each node represents one of the 513 congressmen who voted this bill and each color represents a different political party. (b) Node roles based on the network cartography framework29, with the adaptation that, here, we use the temporal version of the participation coefficient () with averaged within-module-degree, z-scores, from each temporal network slice . Each point represents a congressman and the red color denotes convicted ones. (c) Proportional temporal degree centrality and (d) proportional temporal participation coefficient measures evolution, calculated for all representatives and grouped by political party , for each presidential term. The evolution of both measures coincide precisely with the respective alternation of the ruling parties PSDB (FHC) and PT (Lula and Dilma).

