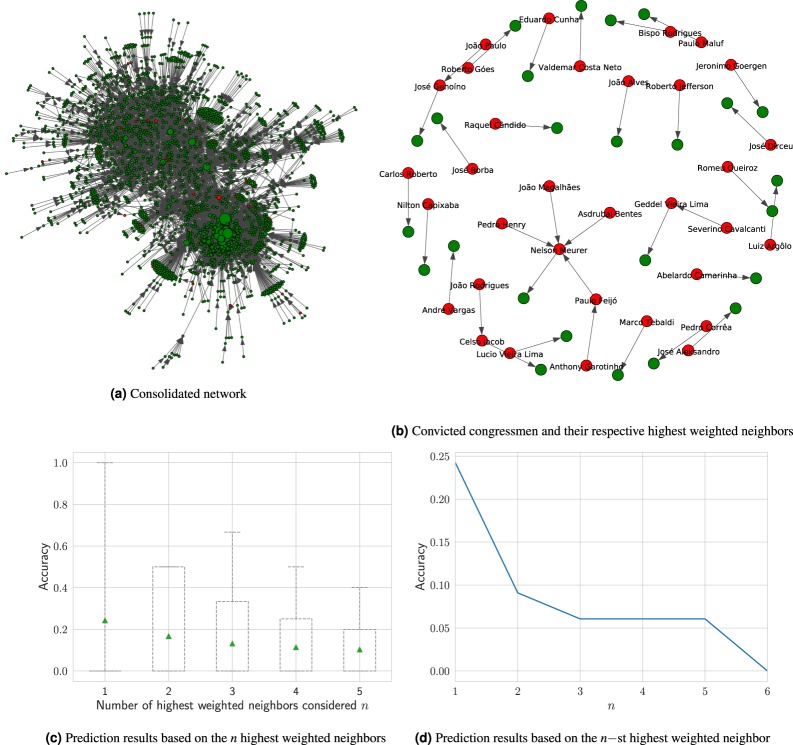
Figure 3.
(a) Representation of the network resulted from the final matrix Wn, with all 2,455 congressmen in the database, disregarding the time factor. Each node is connected to its highest weighted neighbor, in terms of votes similarity on legislative bills. The red color denotes convicted representatives (33 in total). (b) A subgraph of the consolidated network, showed in (a), displaying only the 33 already arrested or convicted representatives (in red) and their respective highest weighted neighbors. We opted for not displaying the names of representatives who currently have not been arrested or officially convicted in this graph (in green). (c) Predictions based on the highest weighted neighbors, in terms of votes similarity, resulted in an average accuracy of 0.243 when . (d) Tests made by considering the n–st highest weighted neighbor of a convicted node show that, as we increase the value of , the lower is the average accuracy.

